
 #04
#04Aquest vídeo i el seu text són en anglès.
Learning rate: the step size with a ceiling you can calculate
Too small is slow, just right lands fast, and past an exact limit training blows up. Learn what the learning rate is and how its ceiling is calculated.
En detall
What the learning rate is
When an AI trains, it keeps nudging its settings in the direction that lowers its error. The learning rate is the number that decides how big each nudge is. It sounds like a minor detail. It is not: the same model, on the same data, can learn fast, crawl, or fall apart depending on this one number.
What the video shows
The step size decides everything. Too small is slow. Just right lands fast. Past an exact limit, the model bounces out of control. And that limit is not found by trial and error: it can be calculated.
An everyday example
Imagine drifting toward the edge of your lane on a motorway and steering back. A tiny correction gets you back to the centre, but slowly. A well-judged one brings you there smoothly. Too much, and you cross the centre and have to correct the other way, zig-zagging. Far too much, and every swing is wider than the last until you leave the road.
The regimes, on the simplest valley
The course starts with the simplest valley there is: the curve x² (x times x), whose lowest point sits at zero. On this curve, every step of gradient descent multiplies your position by the same number, 1 minus twice the learning rate. When that number is negative, you land on the other side of the bottom. This one fact explains everything:
- Below 0.5: you slide smoothly down one side.
- Exactly 0.5: the multiplier is zero, so a single step lands right on the bottom.
- Between 0.5 and 1: you overshoot and zig-zag from side to side, but still get closer.
- Exactly 1: you bounce between the same two points forever.
- Above 1: every bounce is bigger than the last, and the run blows up.
Starting from -1.9, fourteen steps at a rate of 0.1 end at -0.0836. At 0.9 they end at the very same -0.0836, only this time the point hops from one side of the valley to the other on the way. At 1 they end at -1.9, exactly where they started. At 1.2 the point shoots off the chart within four steps. A rate that is too large does not just converge slowly. It never arrives.
How to calculate the ceiling
Models with many settings have a valley with many directions, and near its bottom it bends more sharply in some directions than in others. Every direction has to stay stable at the same time, so the sharpest bend sets the limit. The rule is: keep the learning rate below 2 divided by the valley's largest curvature, meaning how sharply it bends (mathematicians call that number the largest eigenvalue of the matrix of second derivatives).
The course tests this on its factory example, a straight line that predicts a part's weight from its width. The formula predicts a ceiling of 0.13432. Training at 0.13431 works fine. Training at 0.13432 blows up. The prediction and the experiment agree to five decimal places.
Why it matters
The ceiling depends on the data, not only on the model. With the measurements centred, meaning each one is shifted so that the average sits at zero, the ceiling is about 0.134. Run the identical code on the raw millimetres and grams and it collapses to about 0.002. So a learning rate that worked yesterday can blow up tomorrow simply because the data was prepared differently. When training suddenly explodes after a change to the data, the step size may simply be above a new, lower ceiling.
Learn it step by step in Chapter 3 of our free course AI From Scratch: Downhill: Gradient Descent, and the Two Steps Everyone Skips.
També a
Més d'aquest capítol
- #04
 #021
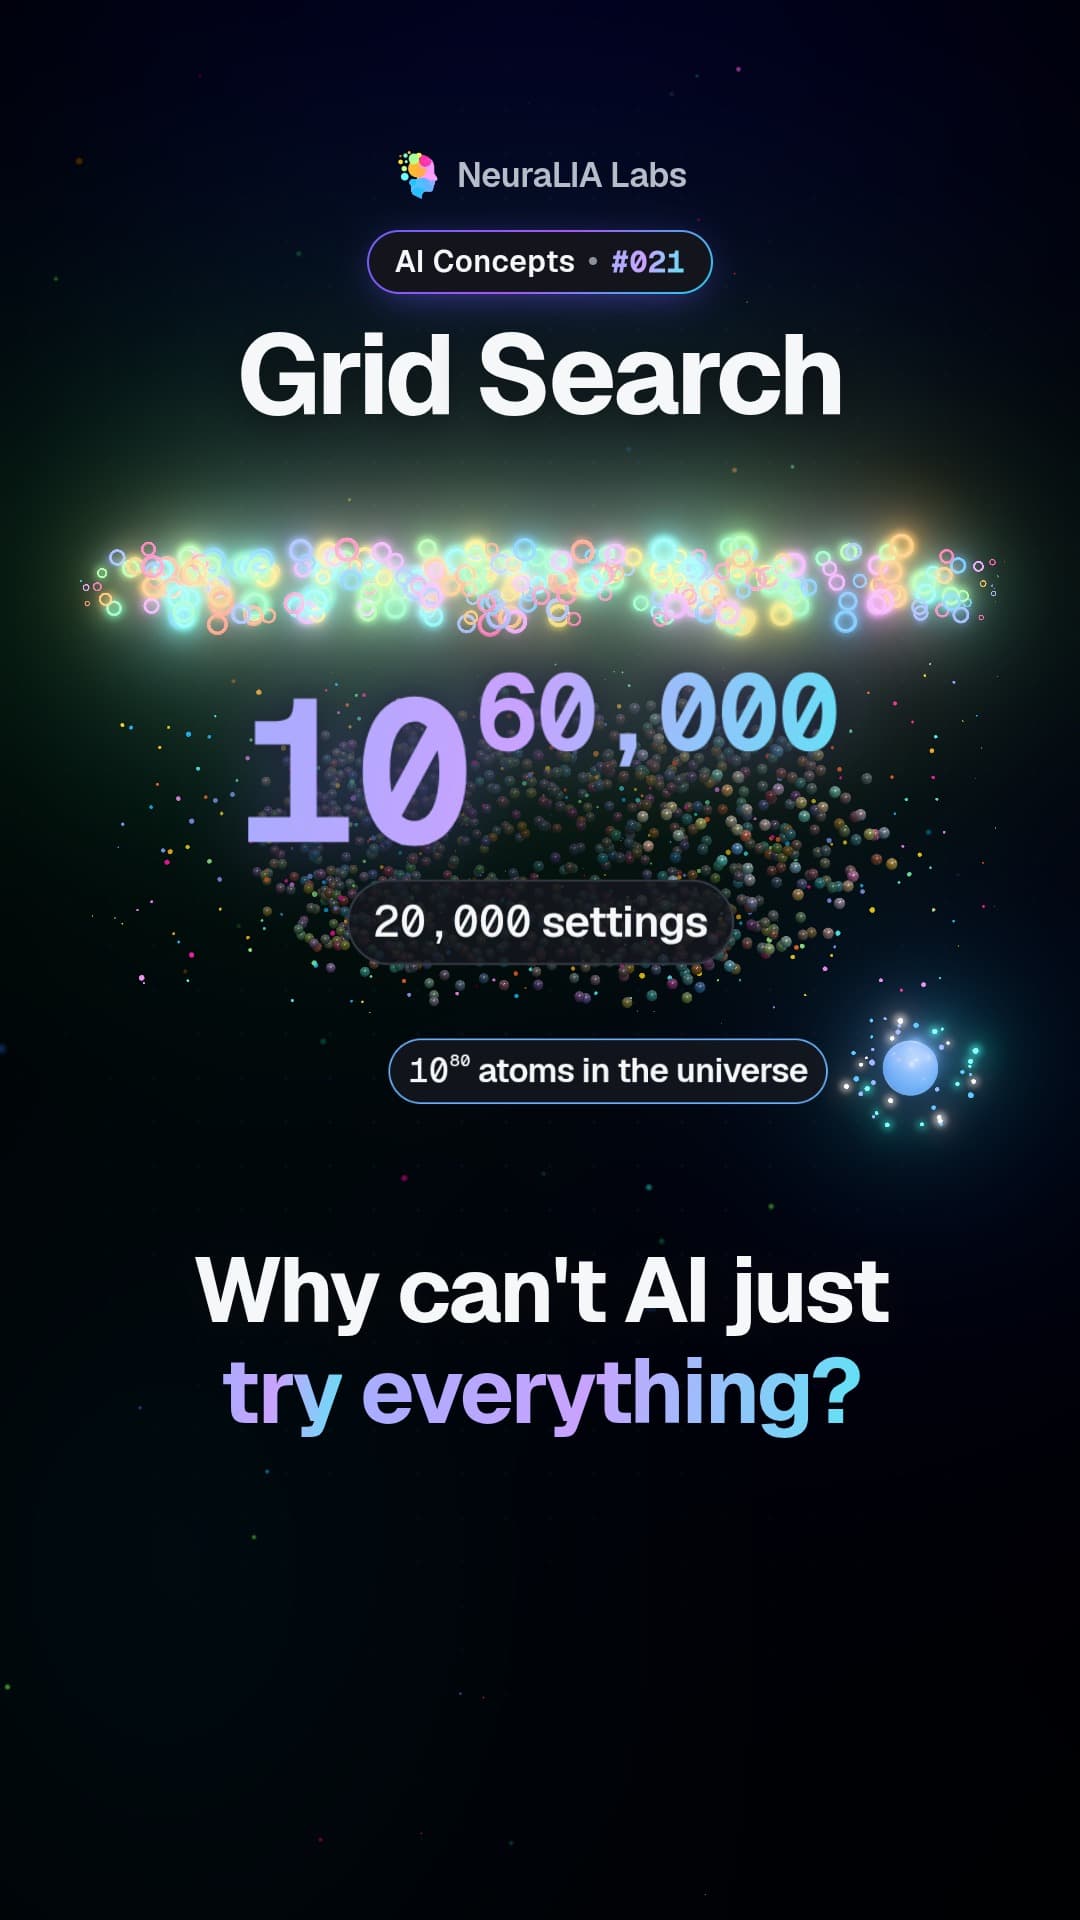
#021Grid search: why you cannot train an AI by trying every setting
 #022
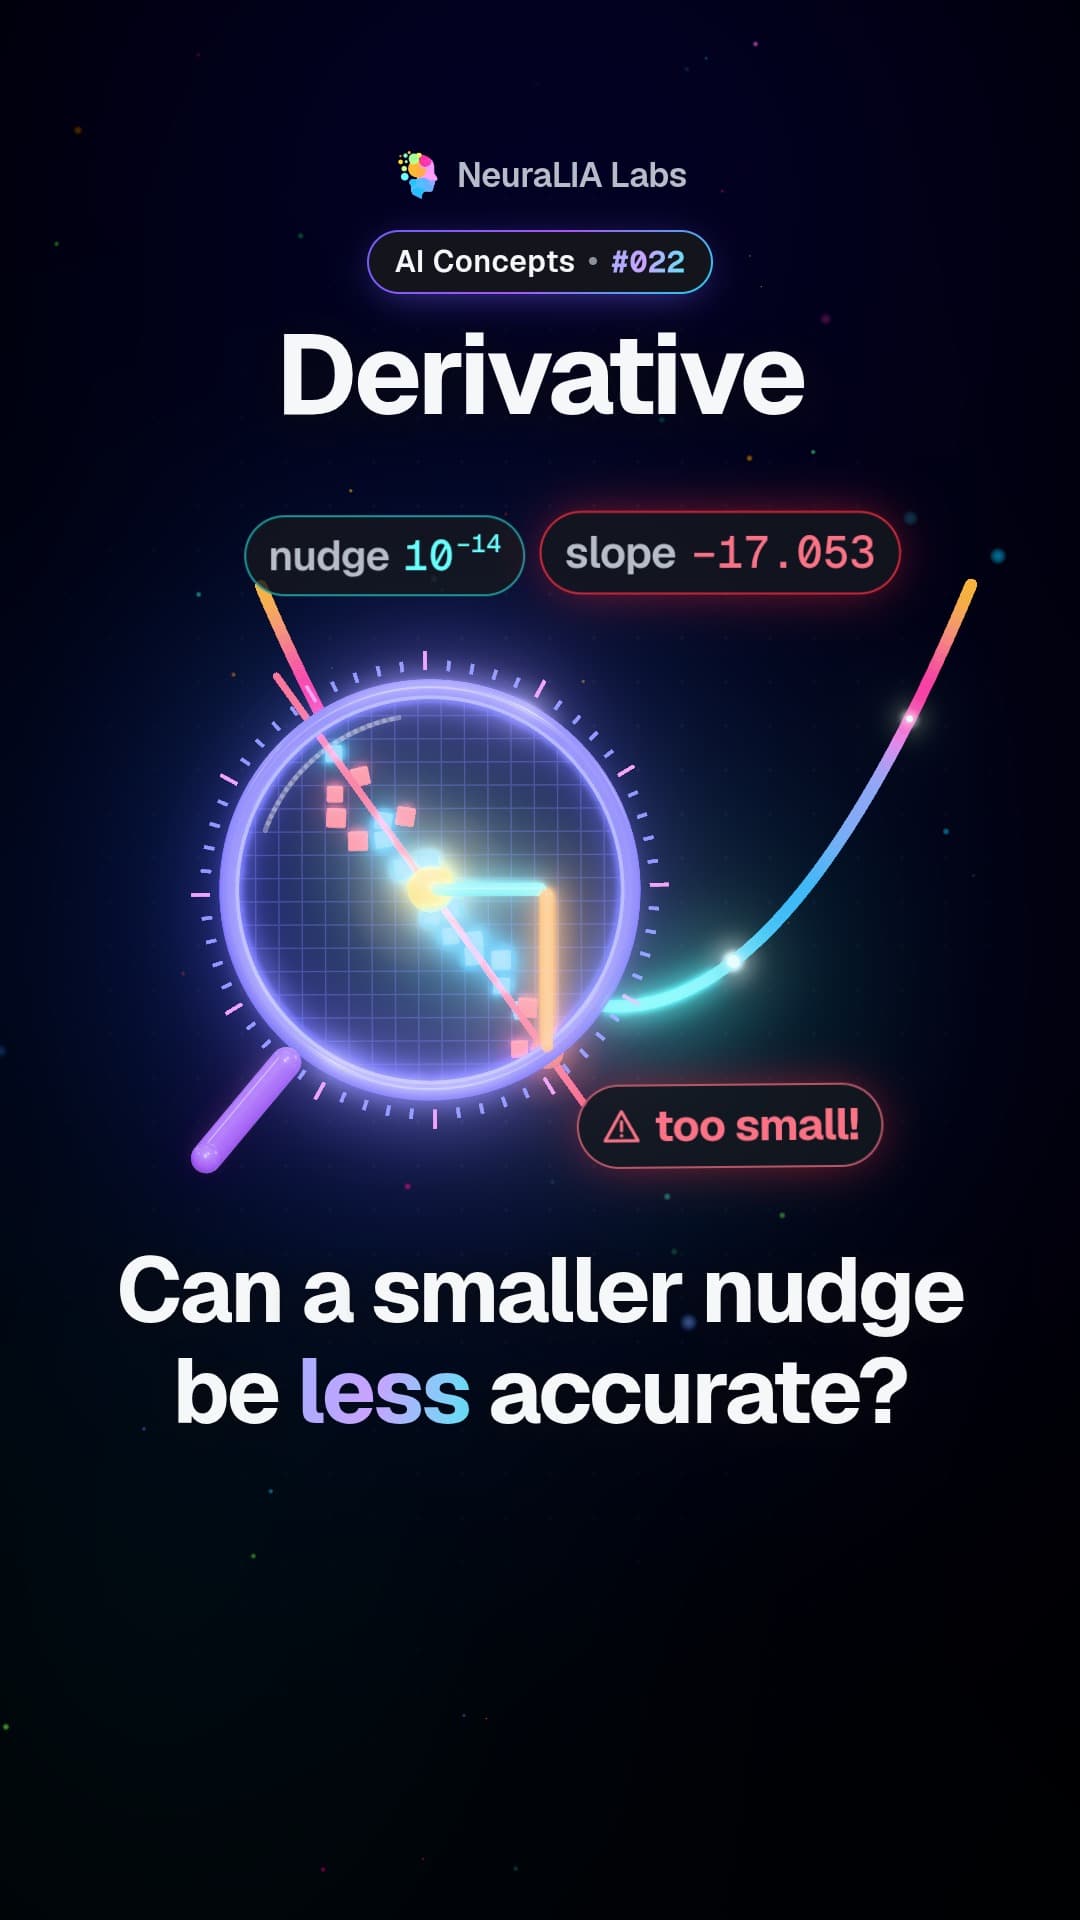
#022Derivative: how much the result moves when you nudge one input
 #023
#023Chain rule: how AI traces the effect of every layer
 #024
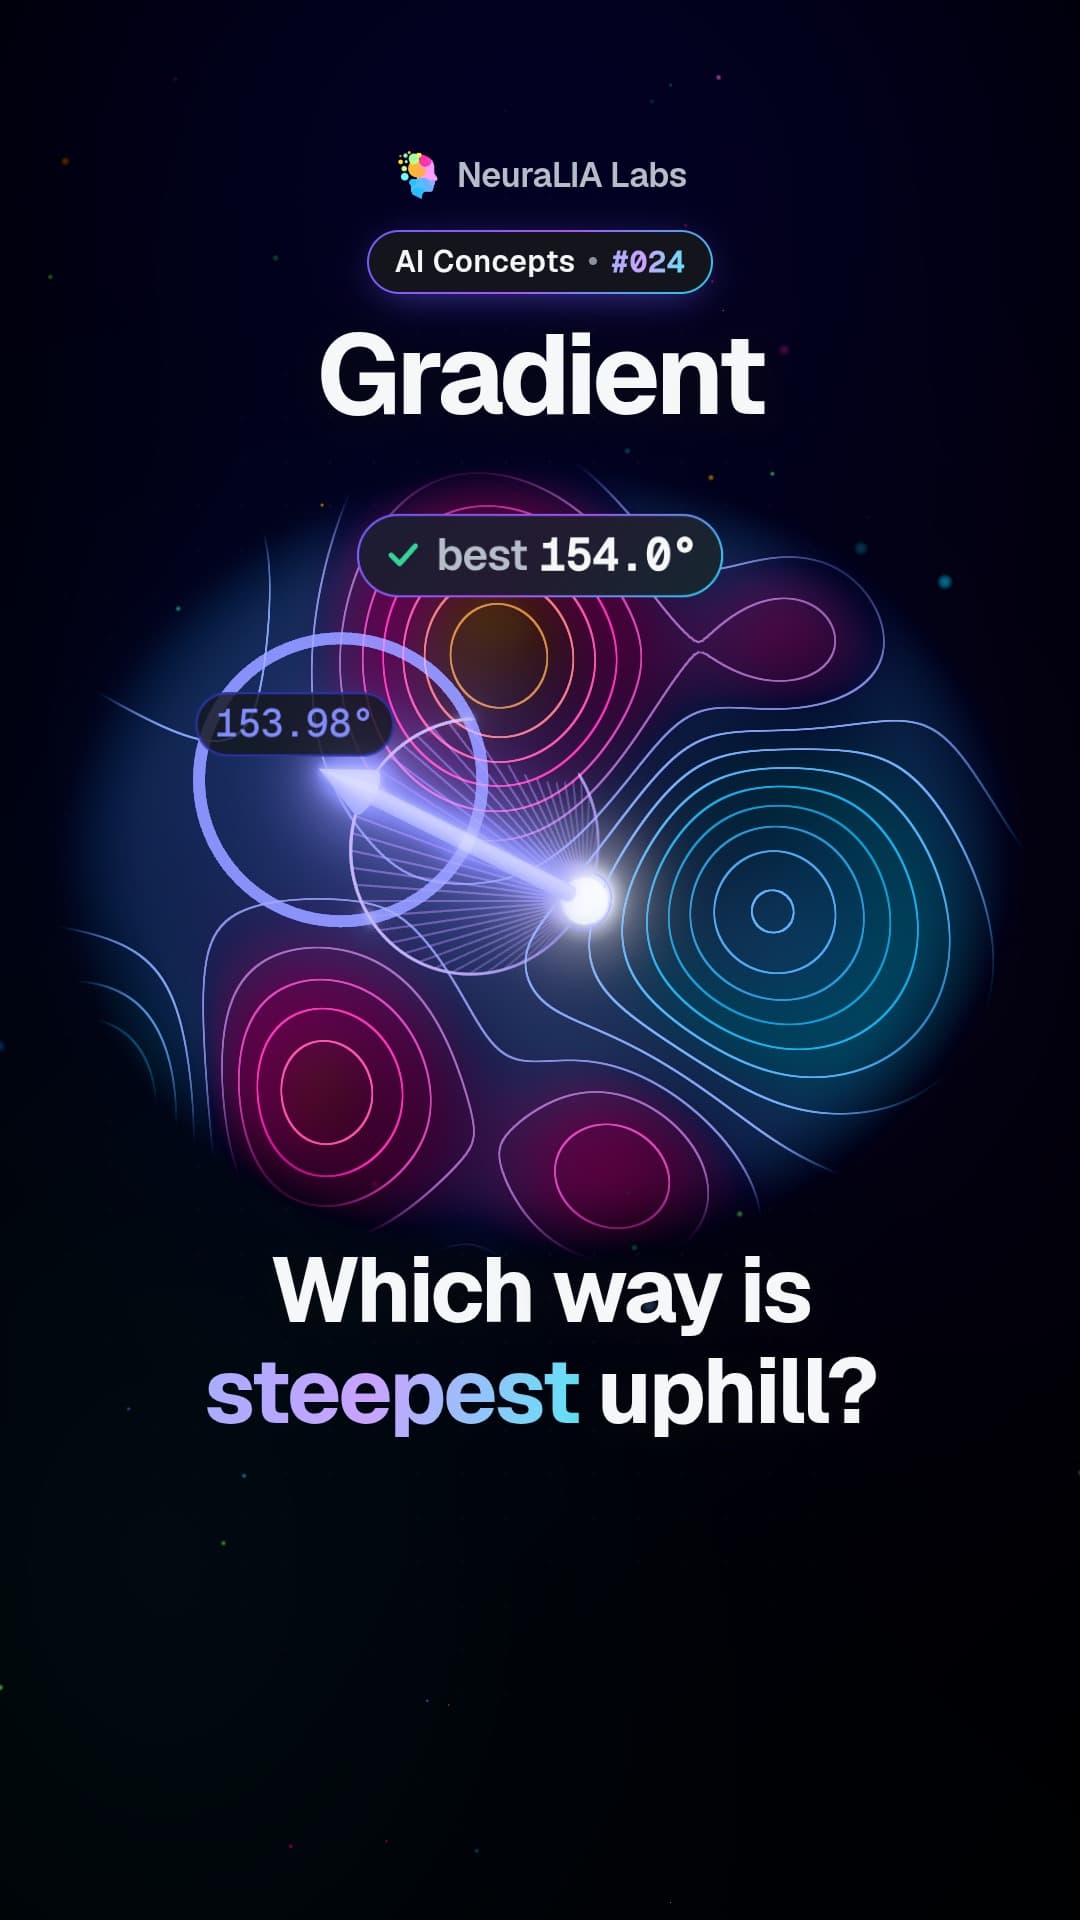
#024Gradient: the arrow that points uphill, and why AI walks the other way
 #025
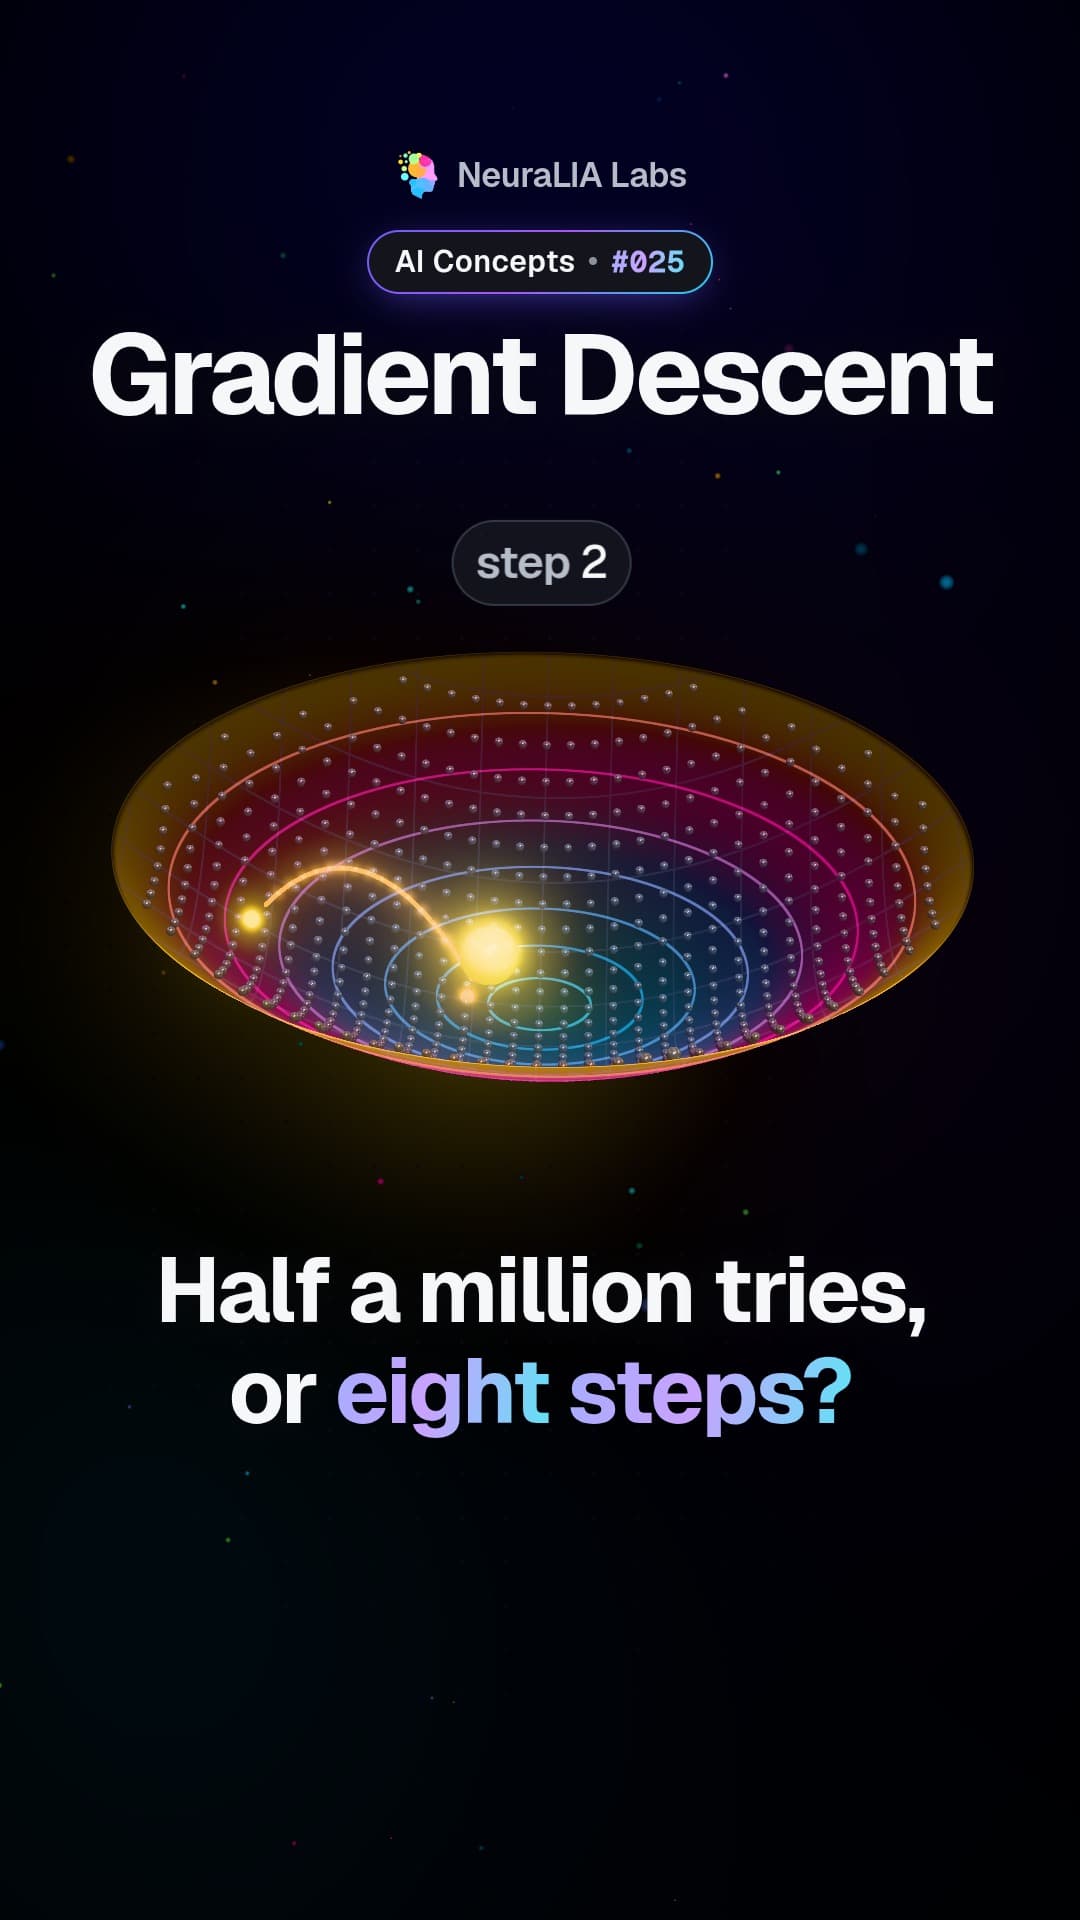
#025Gradient descent: how AI finds its way downhill in small steps
Text escrit amb l'ajuda d'AI a partir del capítol 3 del nostre curs gratuït.