
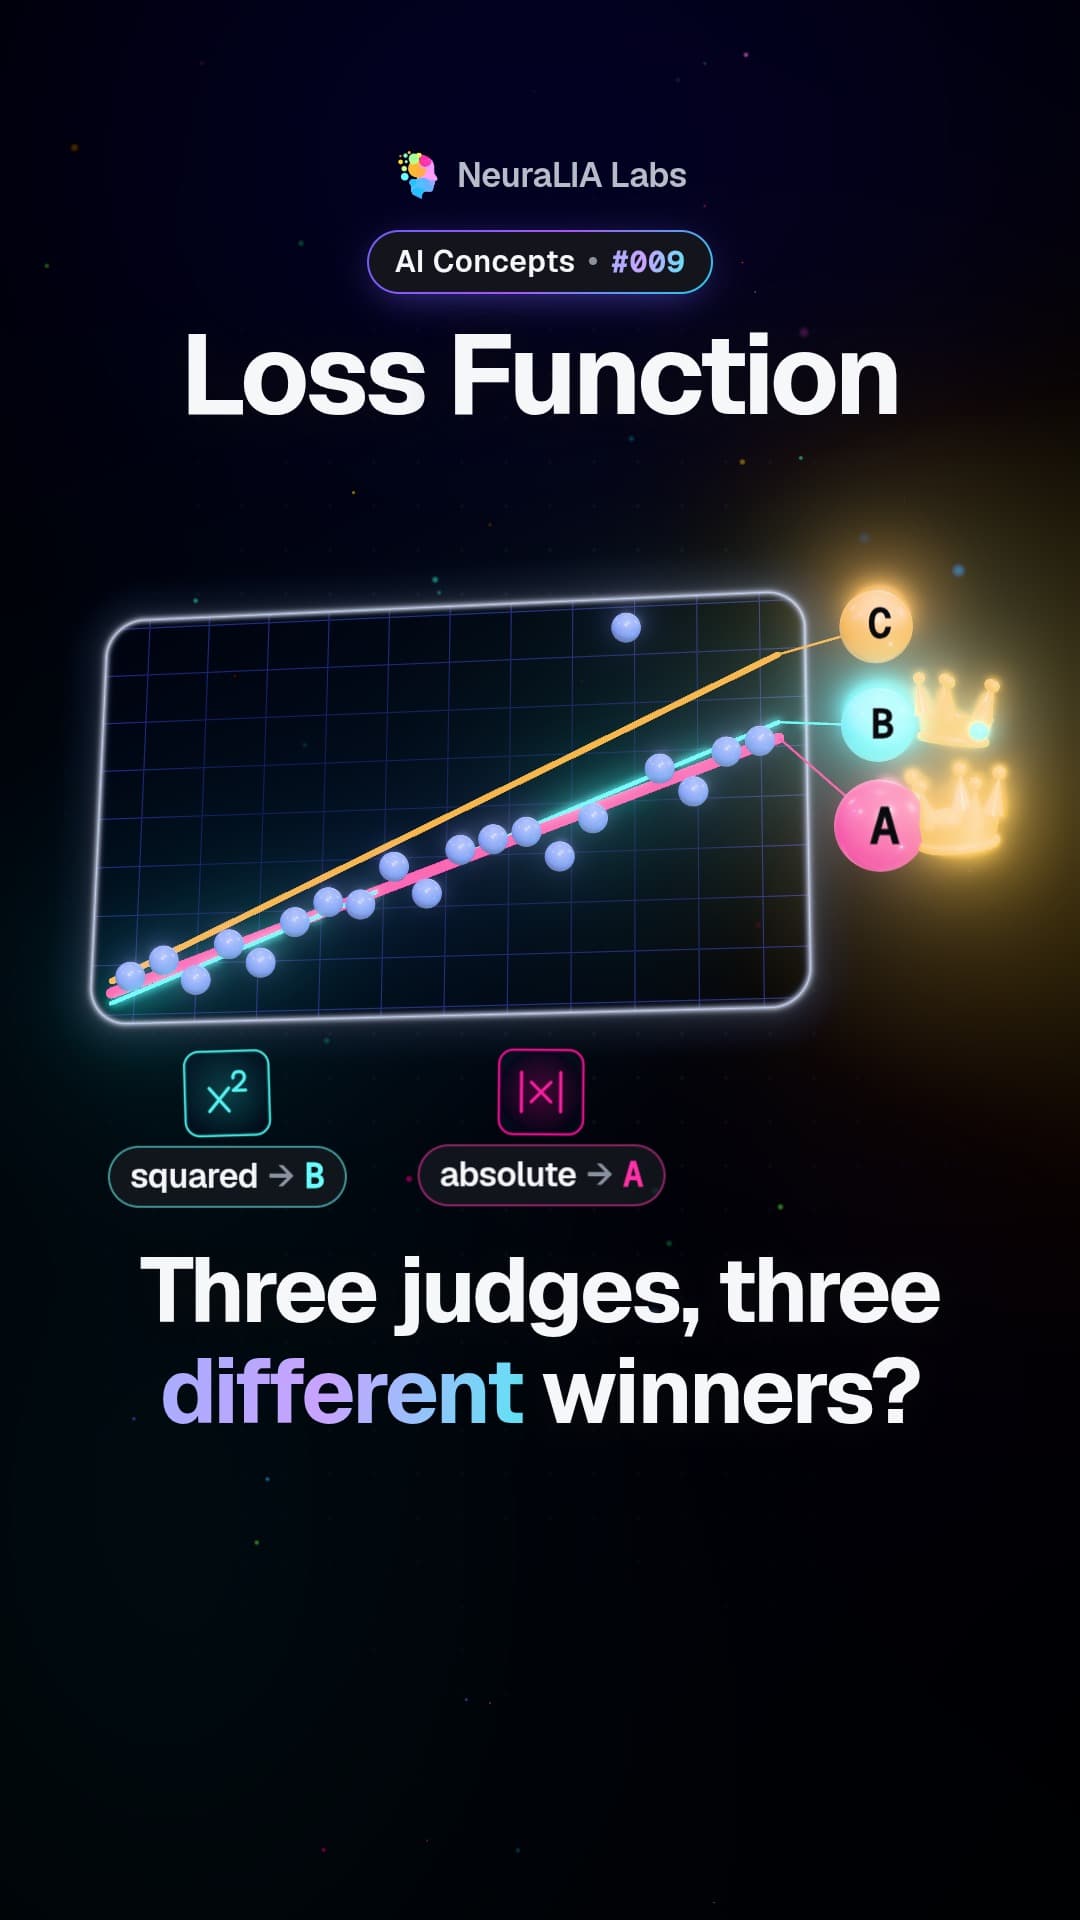
 #009
#009Ez a videó és a szövege angol nyelvű.
Maximum likelihood: the answer that makes your data least surprising
Maximum likelihood picks the answer under which what you actually observed looks least surprising. A plain guide with a coin, a bell curve and real numbers.
Részletesen
What maximum likelihood is
Maximum likelihood is a way to choose between possible answers using the data you already have. For each candidate answer, you ask: if this were the truth, how plausible would my actual data look? Then you pick the candidate that makes your data least surprising.
That plausibility score has a name, the likelihood. It is easy to misread. It is not the chance that the answer is right. It is the chance that the answer gives to the data you really got. The data stays fixed; the candidate answer is the thing you vary.
What the video shows
The video's hook: pick the explanation that makes your data least surprising. Its recipe is to try every possible answer, ask how plausible the data you actually have looks under each one, and keep the answer that makes what you observed as unsurprising as possible.
An everyday example
Imagine flipping a coin 10 times and getting 9 heads. Which is the better explanation: a fair coin, or a coin that lands heads 90% of the time?
- A fair coin gives exactly 9 heads in 10 flips only about 1% of the time.
- A coin that lands heads 90% of the time does it about 39% of the time.
Under the second explanation your result looks ordinary. Under the first it looks like a fluke. Maximum likelihood picks the explanation where your data looks ordinary. Try every possible heads rate from 0% to 100% and the winner is exactly 90%, the rate that matches what you saw.
How it works in the course
The chapter applies the idea to a machine shop: twenty readings of part width, taken as a cutting blade wears down, and a straight line that should follow them. The unknown is the line's slope, meaning how fast the parts grow wider.
- Say what kind of noise you expect. The course assumes each reading is the line plus a small random error shaped like a bell curve: small errors are common, big ones are rare.
- Score each reading. For a candidate slope, every reading misses the line by some amount. The bell curve turns that miss into a plausibility: a reading right on the line scores high, one half a millimetre off scores low.
- Combine them. The readings do not influence each other (the measuring tool has no memory of the last part), so the plausibility of all twenty together is the product of the individual scores. That product is the likelihood of that slope.
The differences are dramatic. A slope of 0.293 millimetres per hour makes the notebook of readings about 46,000 times more plausible than a slope of 0.25, and about 127 million times more plausible than 0.35.
A common misconception
It is tempting to treat maximum likelihood as a law of mathematics that hands you the one correct answer. The course is more careful: it calls it a proposal about what "best" ought to mean. It is a proposal with teeth, though, because you cannot score a single candidate until you have said out loud what kind of noise you expect in your data. Change that assumption and the scores change with it.
Why it matters
This one idea is the root of much of what follows in the course. Each loss function it uses (the rule that turns a model's mistakes into one score) comes from this same move: state the noise you expect, then ask which setting makes the data least surprising.
In practice, multiplying thousands of these scores causes trouble for a computer, so the calculation is done with logarithms instead. That version, the negative log-likelihood, is the next concept in this series.
Learn it step by step in Chapter 2 of our free course AI From Scratch: Where a Loss Function Comes From: Likelihood, Not Convention.
Itt is
Továbbiak ebből a fejezetből
- #009
 #010
#010Loss landscape: training an AI means finding the bottom of a valley
 #011
#011Chain rule of probability: how AI scores a sentence word by word
 #012
#012Bayes' rule: reasoning backwards from a clue to its most likely cause
 #014
#014Negative log-likelihood: turning a fragile product into a calm sum
 #015
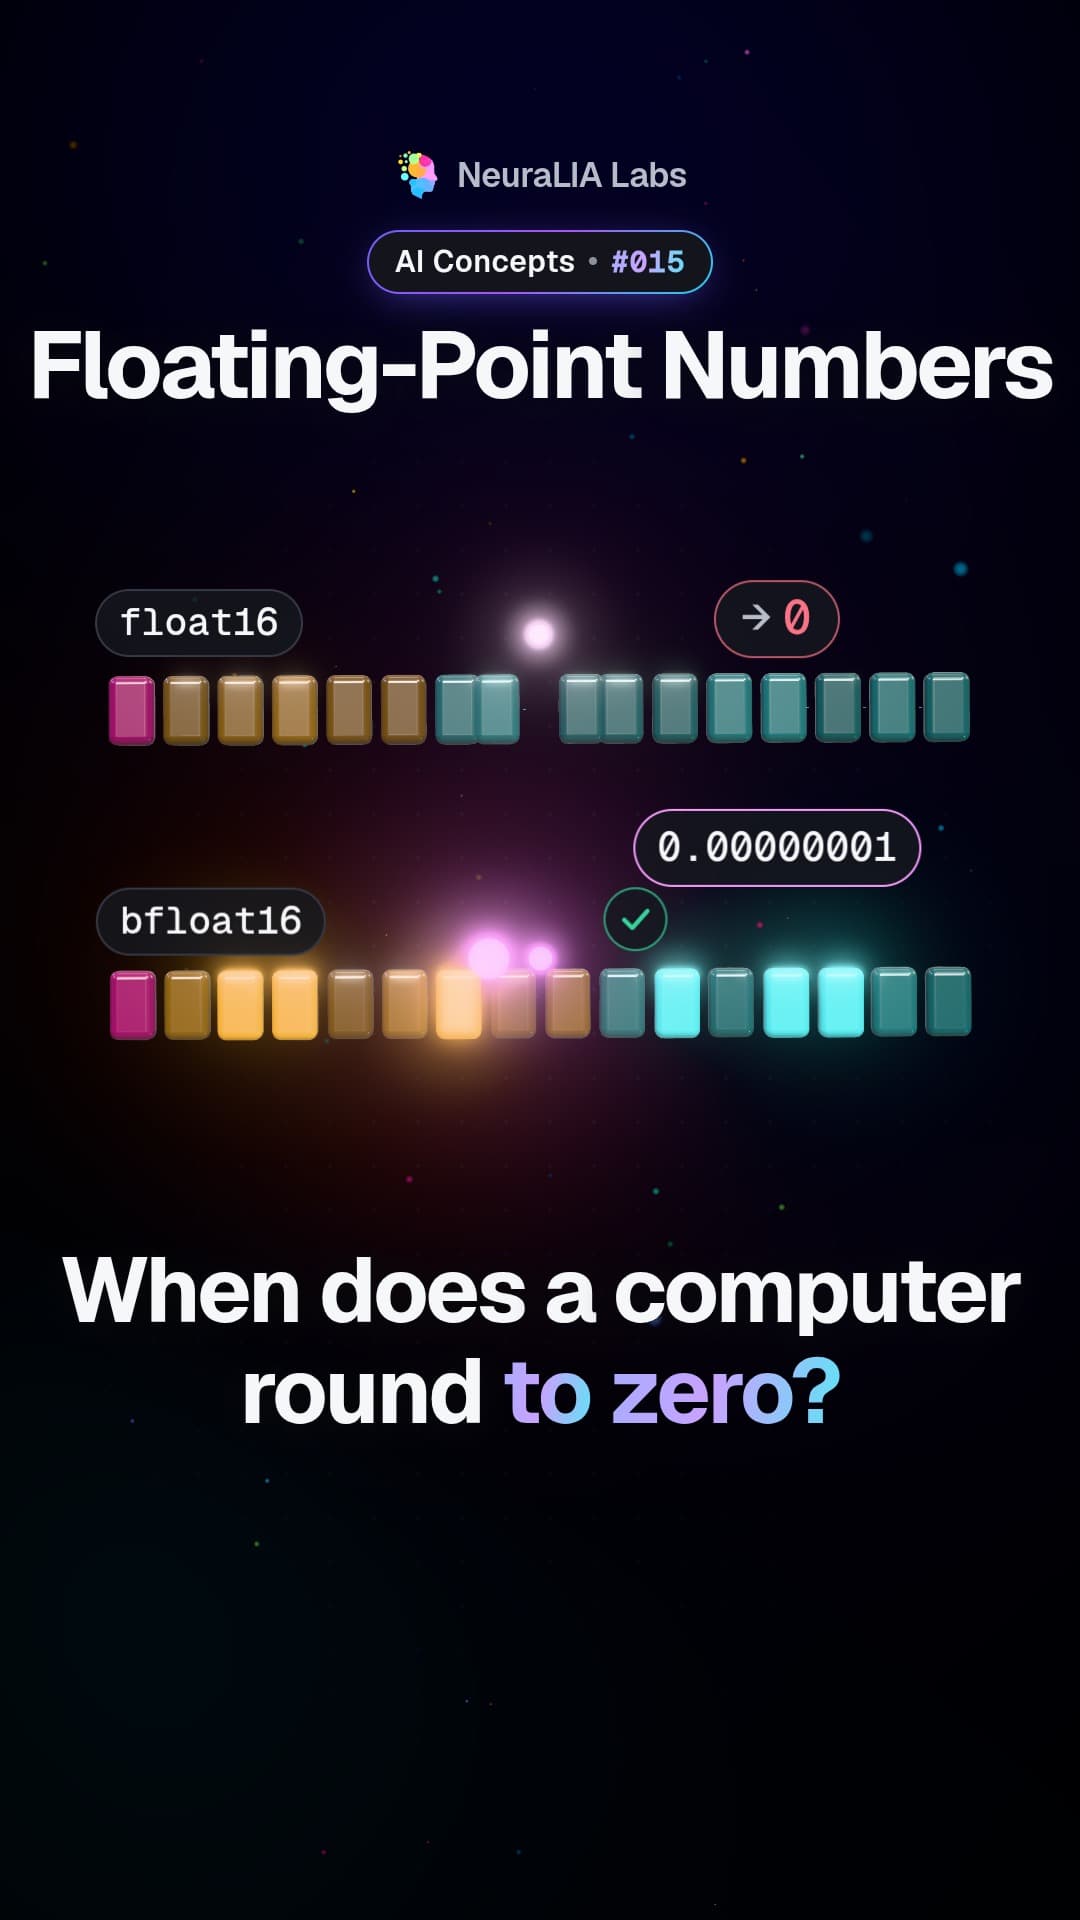
#015Floating-point numbers: why your computer cannot hold every number
A szöveg AI-segítséggel készült az ingyenes kurzusunk 2. fejezete alapján.