
 #033
이 영상과 텍스트는 영어로 제공됩니다.
Confusion matrix: the four boxes that show how a model fails
A single score hides how a model fails. A confusion matrix sorts its answers into four boxes: two kinds of right and two kinds of wrong. Here is how to read one.
자세히
What a confusion matrix is
A confusion matrix is a small table that lines up a model's answers against the truth. For a yes-or-no question it has four boxes:
- True positive: the model said yes, and the answer really was yes. A catch.
- True negative: the model said no, and it really was no.
- False positive: the model said yes, but it was no. A false alarm.
- False negative: the model said no, but it was yes. A miss.
Two boxes hold the right answers. The other two hold the two different ways of being wrong, and that split is the whole point: it shows exactly where the model gets confused.
What the video shows
A single score cannot show how a model fails, but four boxes can: right answers, false alarms and misses. In the video's example, a model that is 98% accurate catches just 8 of 74 defective parts and lets 66 through.
An everyday example
Imagine the spam filter on your email. Its four boxes are: spam sent to the spam folder (a catch), spam that lands in your inbox (a miss), a real email wrongly sent to spam (a false alarm), and a real email delivered normally.
Both mistakes are annoying, but in different ways. A miss clutters your inbox. A false alarm can hide the one message you were waiting for. A single accuracy number blends both into one figure, so you cannot tell which problem you have.
Reading the course's table
In the free course, a model inspects 4,000 parts on a factory belt:
| | Model says fine | Model says defective | |---|---|---| | Really fine | 3,924 (correct) | 2 (false alarms) | | Really defective | 66 (misses) | 8 (catches) |
Add the two correct boxes, 3,924 and 8, and divide by 4,000: that gives the 98.3% accuracy. It looks excellent. Now read the bottom row on its own. Of the 74 parts that were really defective, the model caught 8 and let 66 go out the door.
The two kinds of mistake also cost very different amounts. A false alarm costs a few seconds of extra inspection. A miss means a bad part reaches a customer and may end in a product recall. The table keeps those two costs apart, which is exactly what a single accuracy number cannot do.
How to use it
- Read each row on its own. Each row is one kind of truth. The "really defective" row answers the question that matters here: of the real defects, how many did we catch?
- Put a price on each wrong box. Decide which mistake hurts more before you compare models.
- Build the other scores from it. Precision and recall, which have their own video, are simply two ways of reading this same table.
It works with more than two answers too. The course also sorts parts into four outcomes: ok, and three kinds of defect. Accuracy there is 94%, yet the bigger table reveals that the model finds fewer than half of the "short shot" parts, the ones missing material, because 86% of all parts are fine and they carry the average.
Why it matters
Accuracy tells you how often a model is right. The confusion matrix tells you how it is wrong. Whenever mistakes have different costs, and they almost always do, that second question is the one you need answered before you trust a model.
Learn it step by step in Chapter 4 of our free course AI From Scratch: Classification, Cross-Entropy, and How Not to Fool Yourself.
다른 플랫폼
이 챕터의 다른 영상
- #033
 #034
Cross-entropy: the score that makes AI pay for confident mistakes
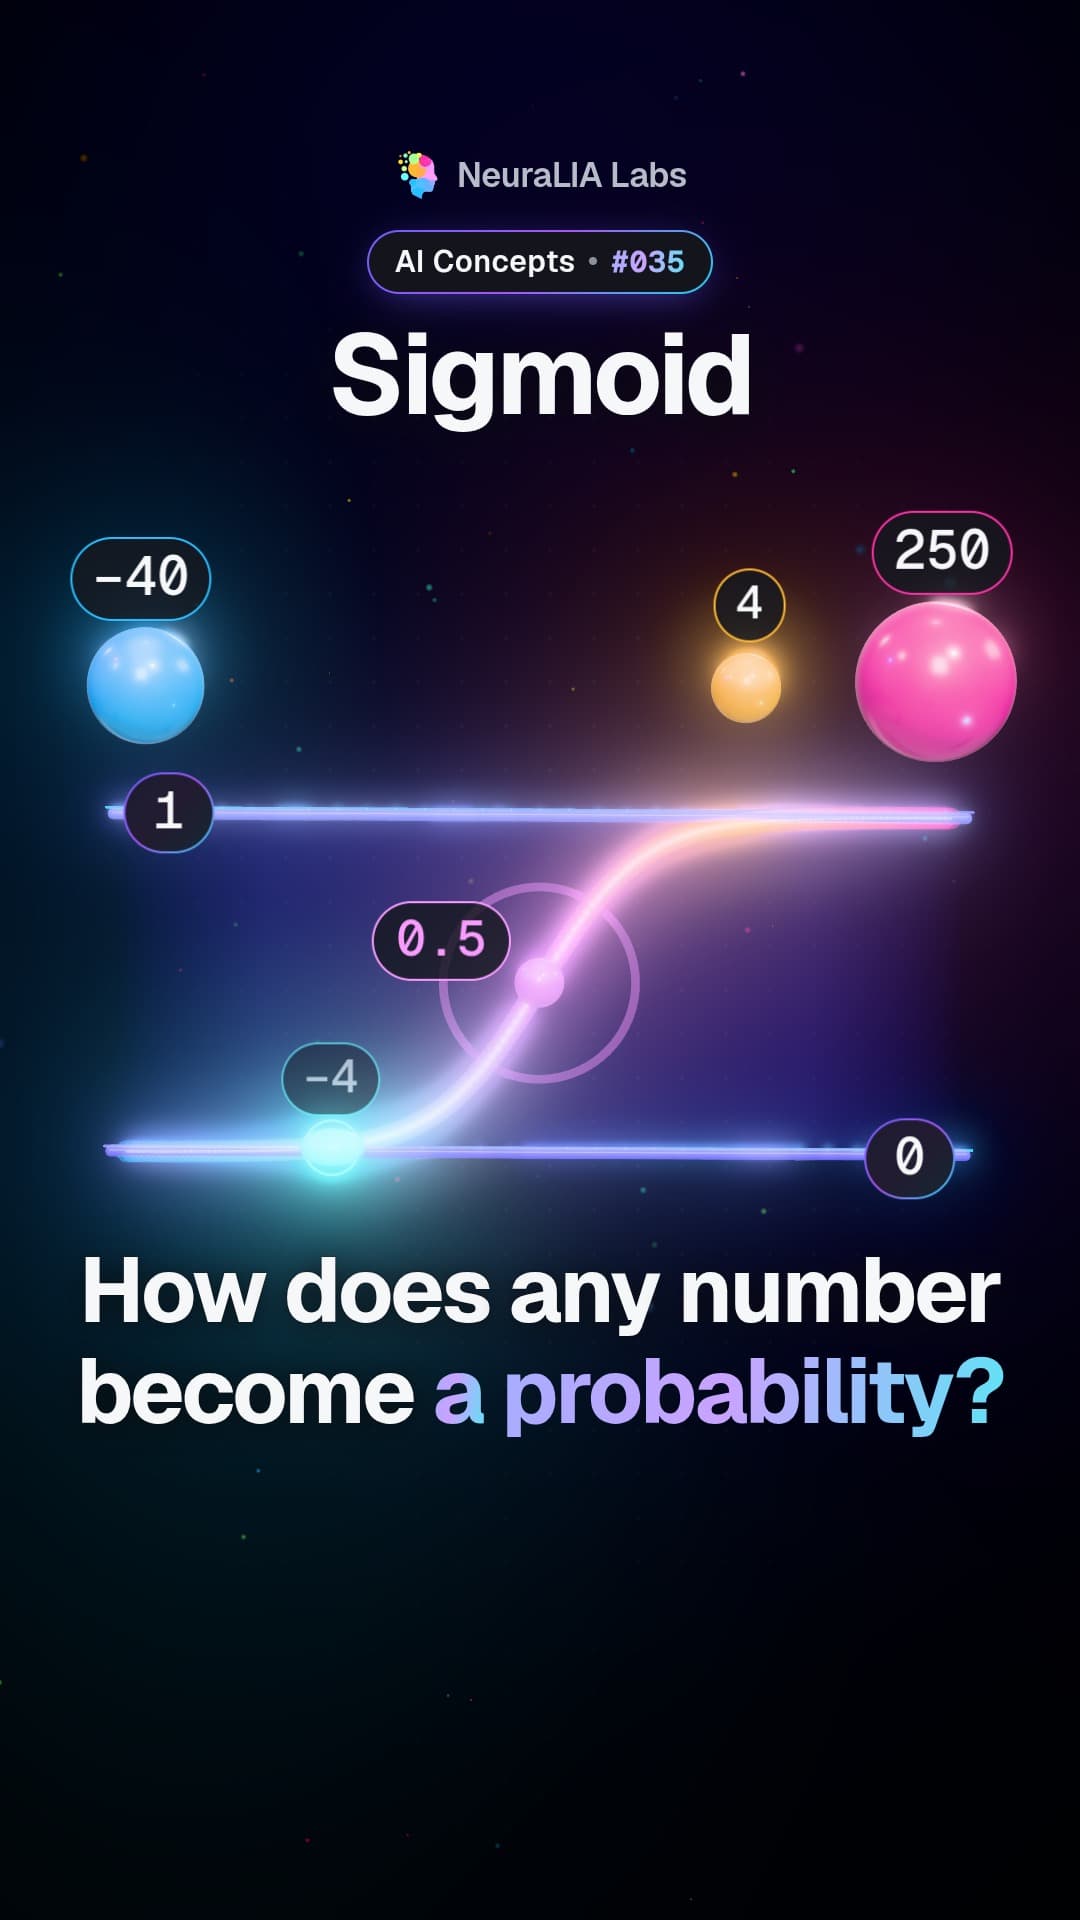 #035
Sigmoid: the S-shaped curve that turns any score into a probability
 #036
Logits: the raw bet a model places before it gives you a percentage
 #037
Cross-entropy vs MSE: why squared error stalls on its worst mistakes
 #038
Entropy: measuring surprise, and the floor no blind guess can beat
무료 강좌 챕터 4의 내용을 바탕으로 AI 도움을 받아 작성한 글입니다.