
 #010
#010此视频及其文本为英文。
Loss function: the scoring rule that decides which answer wins
A loss function turns a model's mistakes into one score. Swap the rule and a different answer wins, which is why choosing it means defining the problem.
详细说明
What a loss function is
A loss function is the rule that turns all of a model's mistakes into one single number, so that one answer can be called better than another. Every prediction misses the real value by some amount. That gap is called the residual: the difference between what the model said and what was actually measured, one number per example. The loss squashes that whole list of gaps into one score, and training means hunting for the settings that make the score as small as possible.
It sounds like bookkeeping. It is not. The rule you pick is what decides what "best" means.
What the video shows
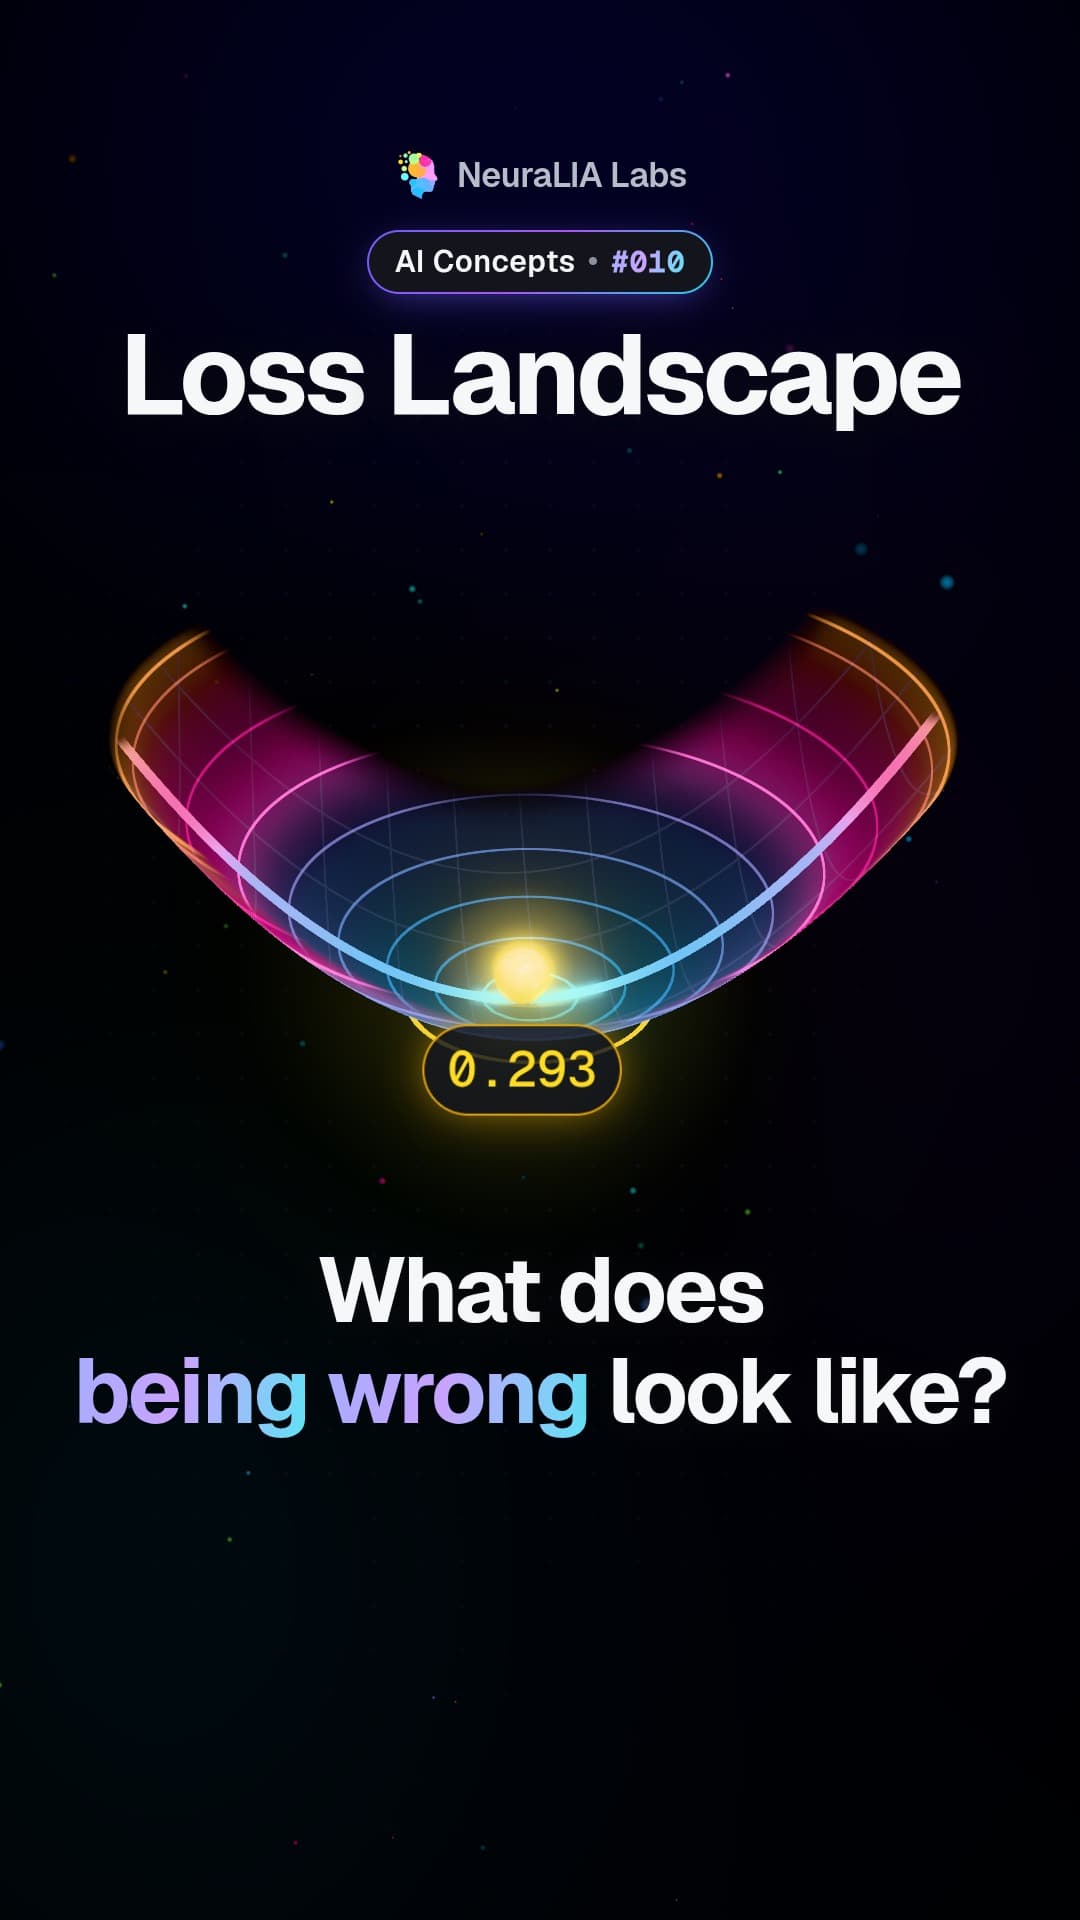
The video's hook is simple: same data, three "best" answers. A model needs some rule to turn its mistakes into a score, and when you swap the rule, a different answer comes out on top. The data did not change. Only the definition of "best" did.
An everyday example
Imagine three delivery drivers, each with four deliveries. Their delays, in minutes:
- Driver A: 0, 0, 0 and 16.
- Driver B: 3, 3, 3 and 9.
- Driver C: 7 every time.
Now judge them three ways:
- Average delay, where every minute counts the same: A wins with 4 minutes, against 4.5 for B and 7 for C.
- Average squared delay, where each delay is squared first, so 16 minutes costs 256 but 3 minutes costs only 9: B wins with 27, against 49 for C and 64 for A.
- Worst delay, where only the single worst delivery counts, because one late wedding cake is a disaster: C wins with 7, against 9 for B and 16 for A.
Same deliveries, three winners. None of the judges is wrong. Each is answering a different question about what a good driver is.
How it works in the course
The course makes the same point with real measurements. It has twenty readings from a machine shop: the hours since a cutting blade was last replaced, and how wide the part came out at that time. Three hand-drawn straight lines try to follow the readings, and each gets scored three ways. Misses are in millimetres, so the squared column is in square millimetres:
| Line | Average squared miss | Average miss | Worst miss | |---|---|---|---| | A | 0.0270 | 0.126 | 0.430 | | B | 0.0252 | 0.137 | 0.350 | | C | 0.0318 | 0.150 | 0.320 |
Squared error picks B. Absolute error (the average size of the misses, over or under) picks A. Worst error picks C, and that is the rule a machinist might care about most: an inspector throws out any single part that falls outside the allowed size range, however good the average looks.
The course is candid: its author picked these three lines on purpose so they would disagree, and notes that trios like this take only minutes to find. That is the point: the ranking flips easily.
Why it matters
Which line wins is decided by the scoring rule, not by anything special about the lines. So choosing a loss is not a technical detail to leave to a software default. It is the moment you decide which problem you are solving. A line that is best on average can still make the occasional large miss, and a line that avoids big misses can be slightly worse on a typical reading.
That leaves the real question: on what grounds should you pick the rule? The chapter's answer, built step by step, is that each loss the course uses follows from a stated assumption about how the measurements got their errors in the first place.
Learn it step by step in Chapter 2 of our free course AI From Scratch: Where a Loss Function Comes From: Likelihood, Not Convention.
也可在
本章更多内容
- #010
 #011
#011Chain rule of probability: how AI scores a sentence word by word
 #012
#012Bayes' rule: reasoning backwards from a clue to its most likely cause
 #013
#013Maximum likelihood: the answer that makes your data least surprising
 #014
#014Negative log-likelihood: turning a fragile product into a calm sum
 #015
#015Floating-point numbers: why your computer cannot hold every number
文案由 AI 辅助撰写,基于我们免费课程第 2 章。