
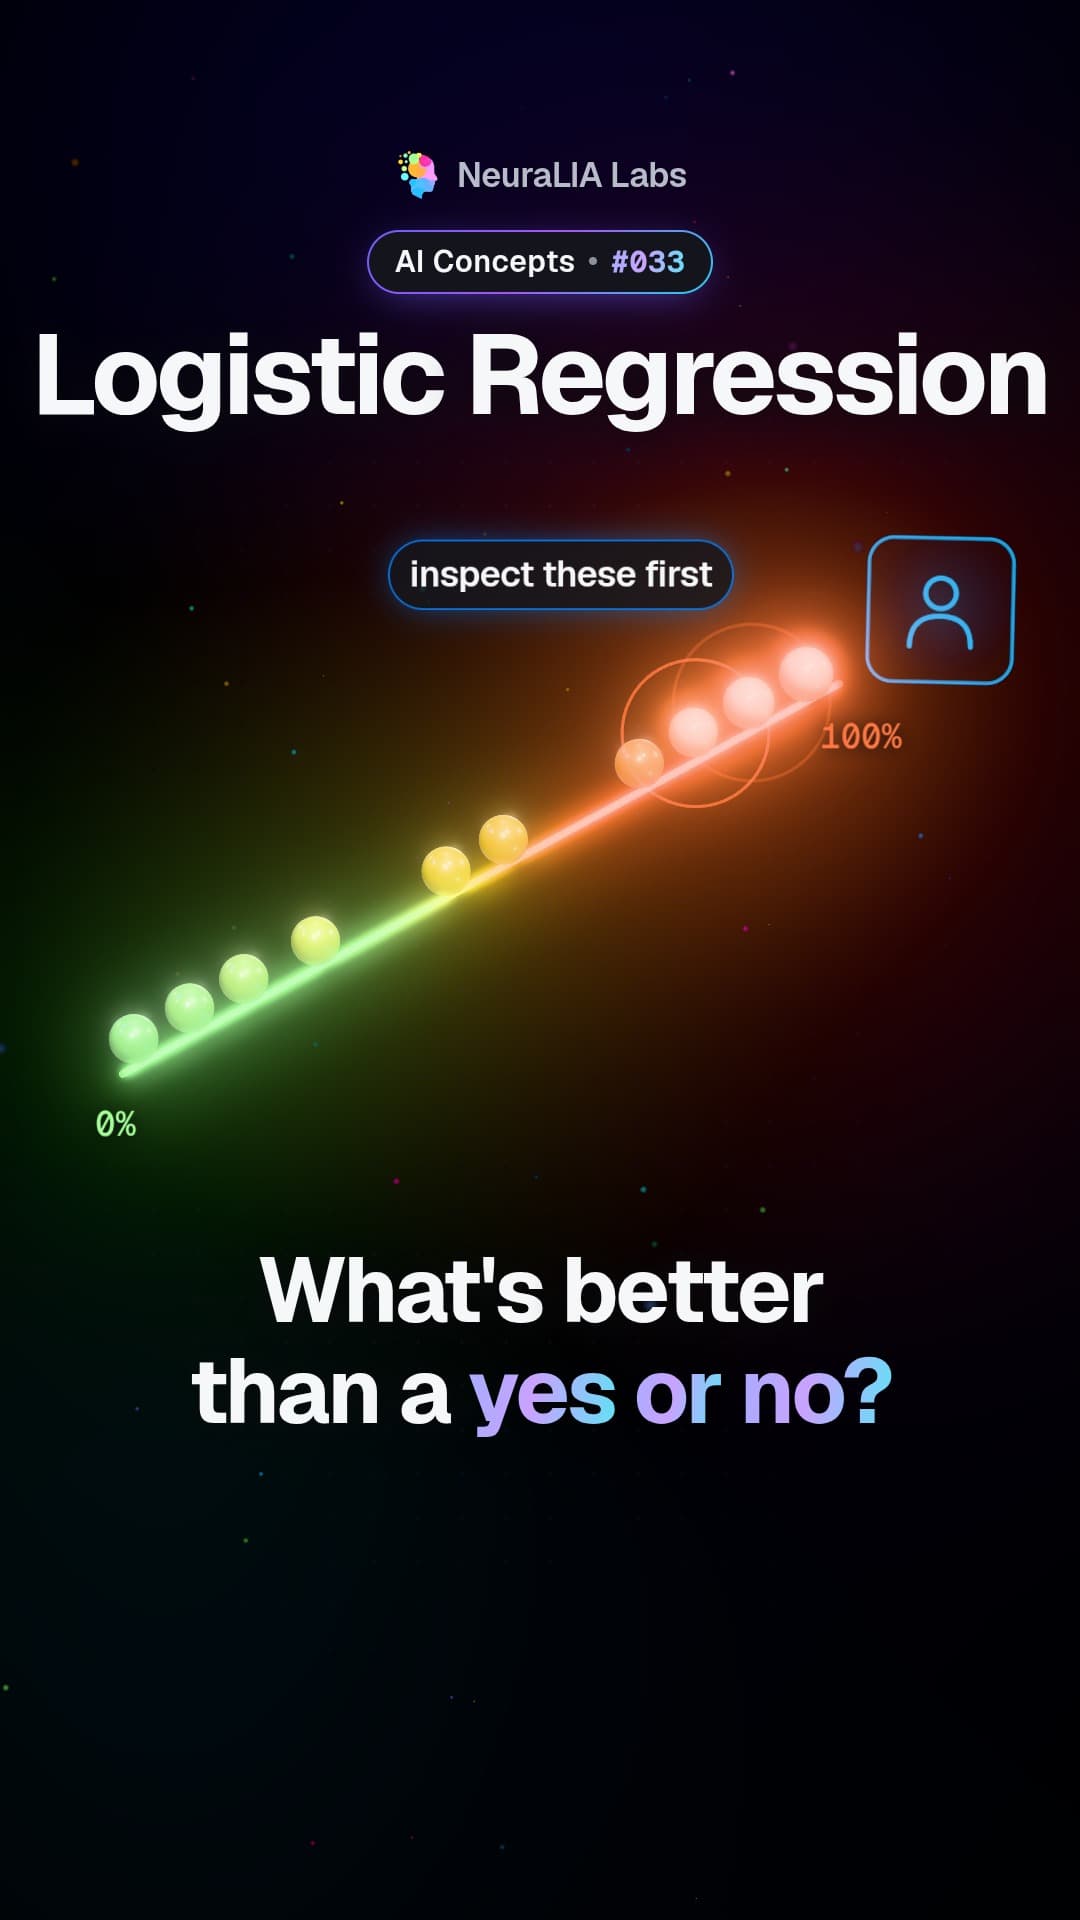
 #033
Bu video ve metni İngilizcedir.
Confidence intervals: why 17 out of 20 proves less than you think
A score from a small test is a range, not a point. See what 17 out of 20 really says about an AI model, and why every honest report shows the interval.
Kursta anlatılıyor30 bölümden 4. bölümSınıflandırma, çapraz entropi ve kendini kandırmamanın yolları
Ayrıntılı olarak
What a confidence interval is
When you test an AI model, you only see a sample of the cases it will ever face. The score you get is an estimate, and estimates wobble. A confidence interval is the honest way to report it: instead of one number, you give a range of values for the model's real performance that fit what you observed. A 95% interval comes from a method that, used again and again, captures the true value about 95 times in 100.
What the video shows
The video looks at a score of 17 out of 20, which is 85% on paper. But a score from only 20 tests is not precise: the honest reading of 17 out of 20 is anywhere from about 64% to 95%. And a much weaker model gets that lucky about once in every 23 tries. In the course, that weaker model is one that is really right only 65% of the time.
An everyday example
Imagine a basketball player who makes 17 of her 20 free throws in practice. Is she an 85% shooter? Maybe. She could also be a 70% shooter on a good day, or a 90% shooter on a slightly off day. Twenty shots are simply not enough to tell those apart. After a few thousand shots, you would trust her percentage far more. The arithmetic is exactly the same for an AI model answering test questions.
How it works
For a simple right-or-wrong success rate, the course uses the Wilson interval, a short formula (about ten lines of code) that stays reliable even with very few examples. The simpler formula found in many textbooks misbehaves when the score is close to 0% or 100%.
The numbers behind 17 out of 20 are worth seeing side by side:
- A model that is truly 85% accurate scores 17 or more out of 20 only about two times in three.
- A model that is truly 65% accurate still manages it about 4.4% of the time.
So 17 out of 20 cannot reliably tell those two models apart. And if you tried a handful of prompts or versions and reported only the best run, you may have created that lucky result yourself.
Three things decide whether you can trust the range at all:
- The count that matters. A test of 4,000 factory parts sounds large. But if you quote how many of the 74 defective parts were caught, your sample is 74, and the range on that figure is about 11 points either way.
- Truly separate examples. Several photos of one part, or several questions written from one document, count as much less than several independent examples.
- Looking once. Each extra version you score on the same test is another chance for luck to hand you a false winner.
More examples narrow the range, but slowly: halving its width takes roughly four times the data. How many you need is a topic of its own in this series.
Why it matters
A single number invites comparisons it cannot support. In the course, a tuned model's F1 score (one number that combines how often its alarms are right and how many defects it catches) is 0.41, with a range of about 0.30 to 0.52, and that range is what belongs in the report. Whenever someone quotes a model's score from a small test, ask for the interval. If it is wide, the headline number is closer to a guess than a measurement.
Learn it step by step in Chapter 4 of our free course AI From Scratch: Classification, Cross-Entropy, and How Not to Fool Yourself.
Şurada da
Bu bölümden daha fazlası
- #033
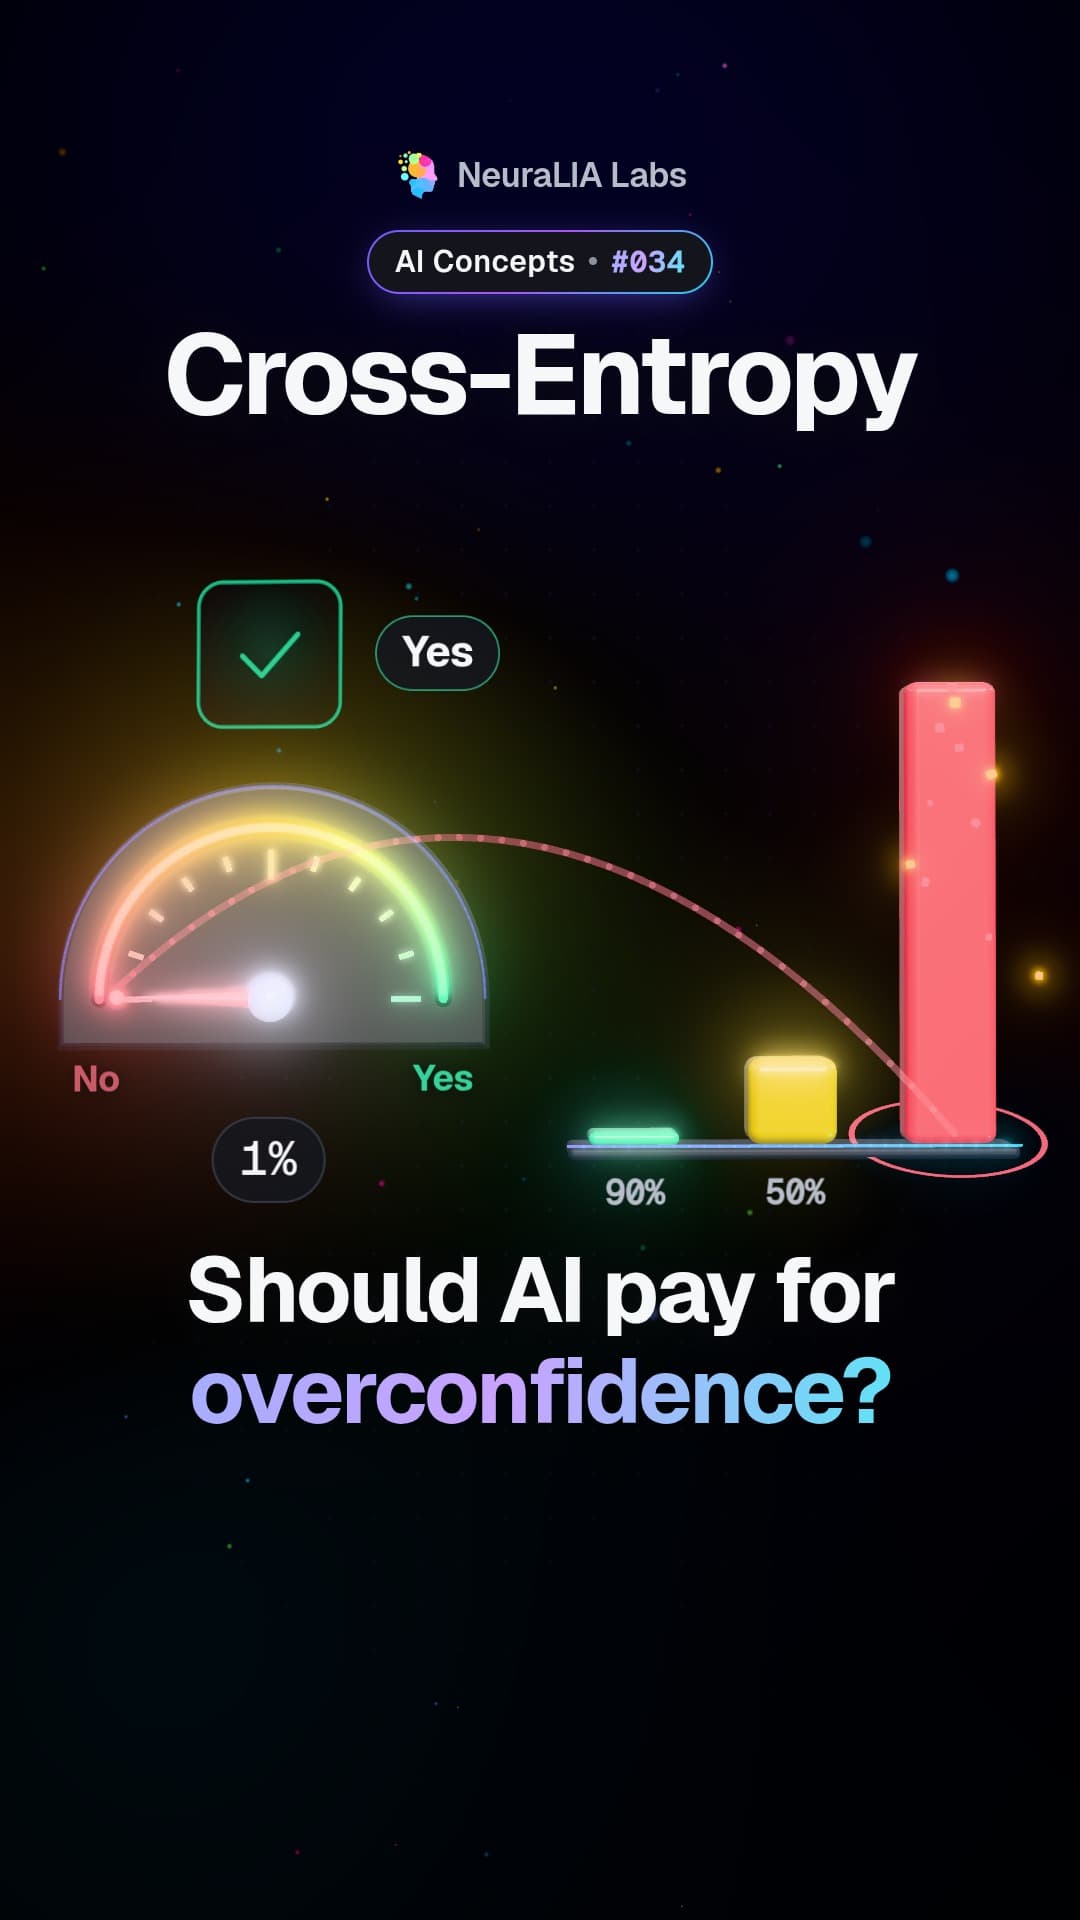 #034
Cross-entropy: the score that makes AI pay for confident mistakes
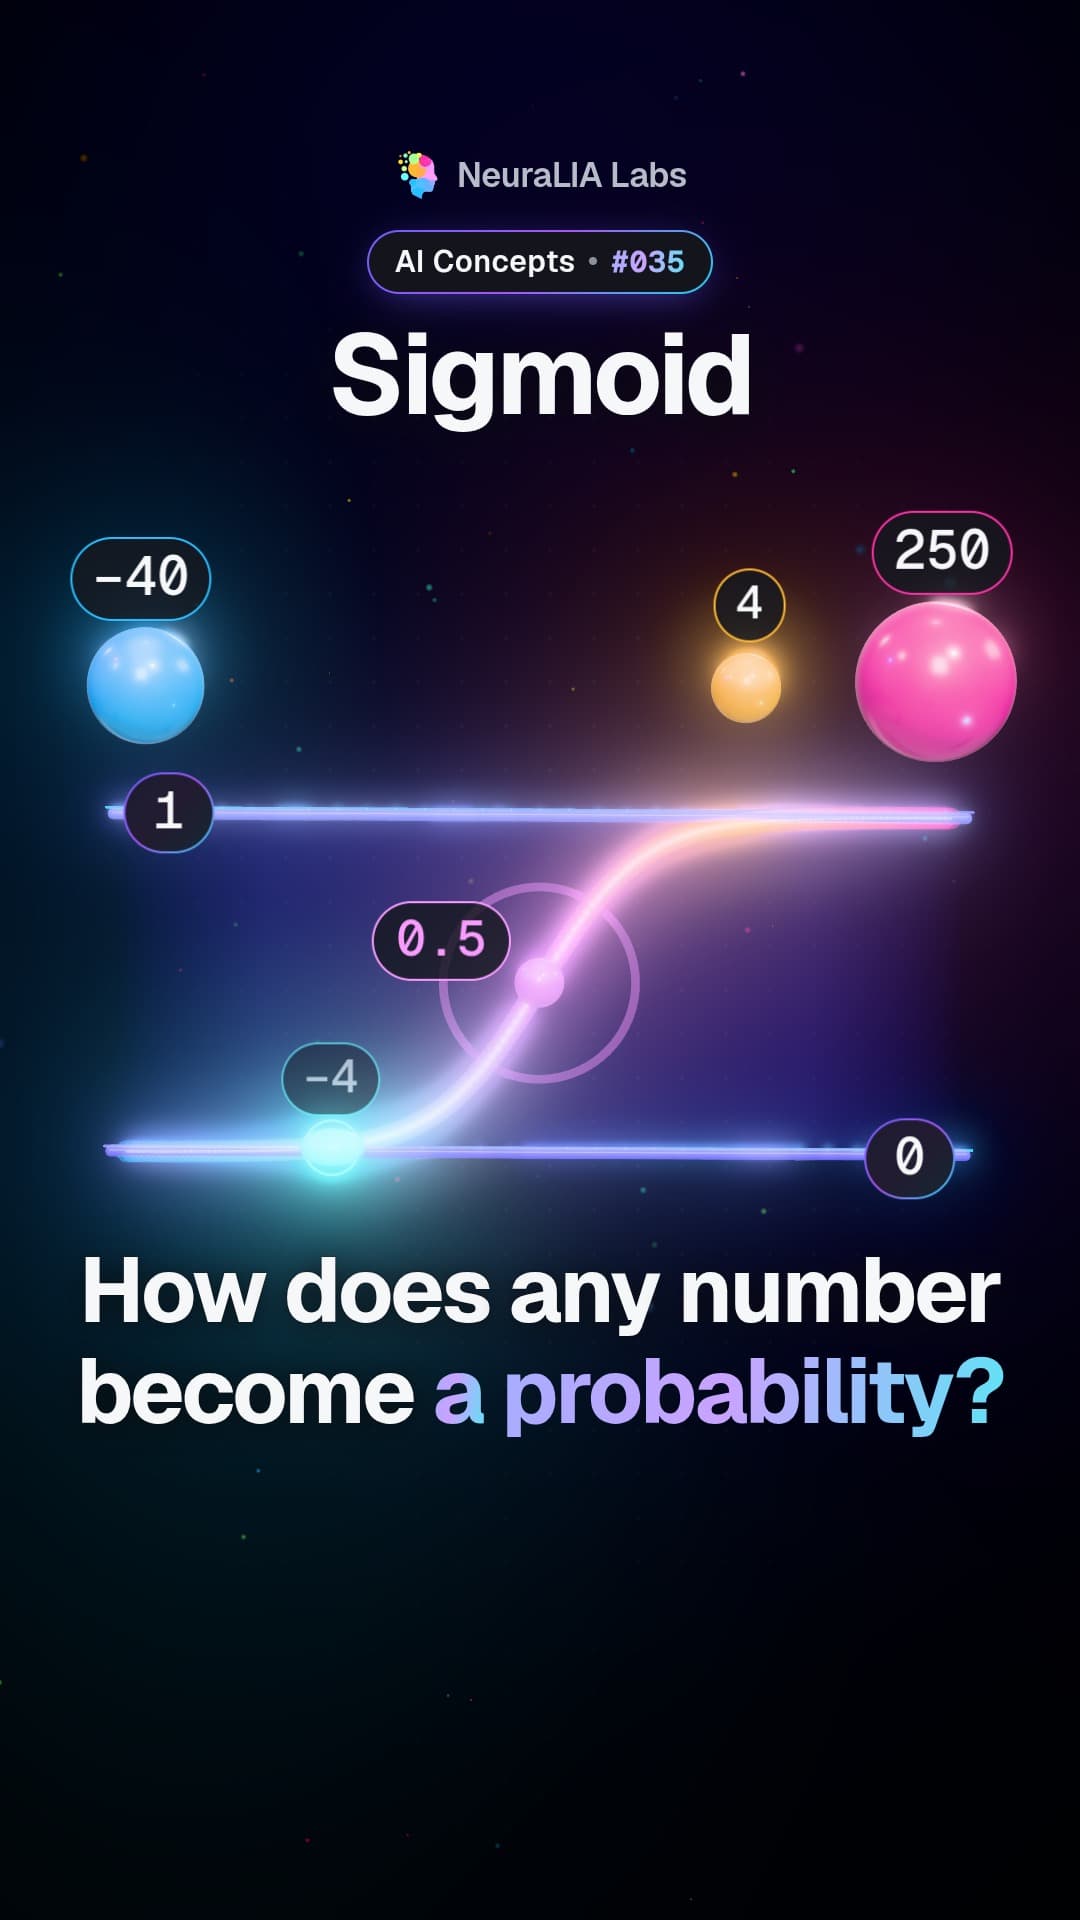 #035
Sigmoid: the S-shaped curve that turns any score into a probability
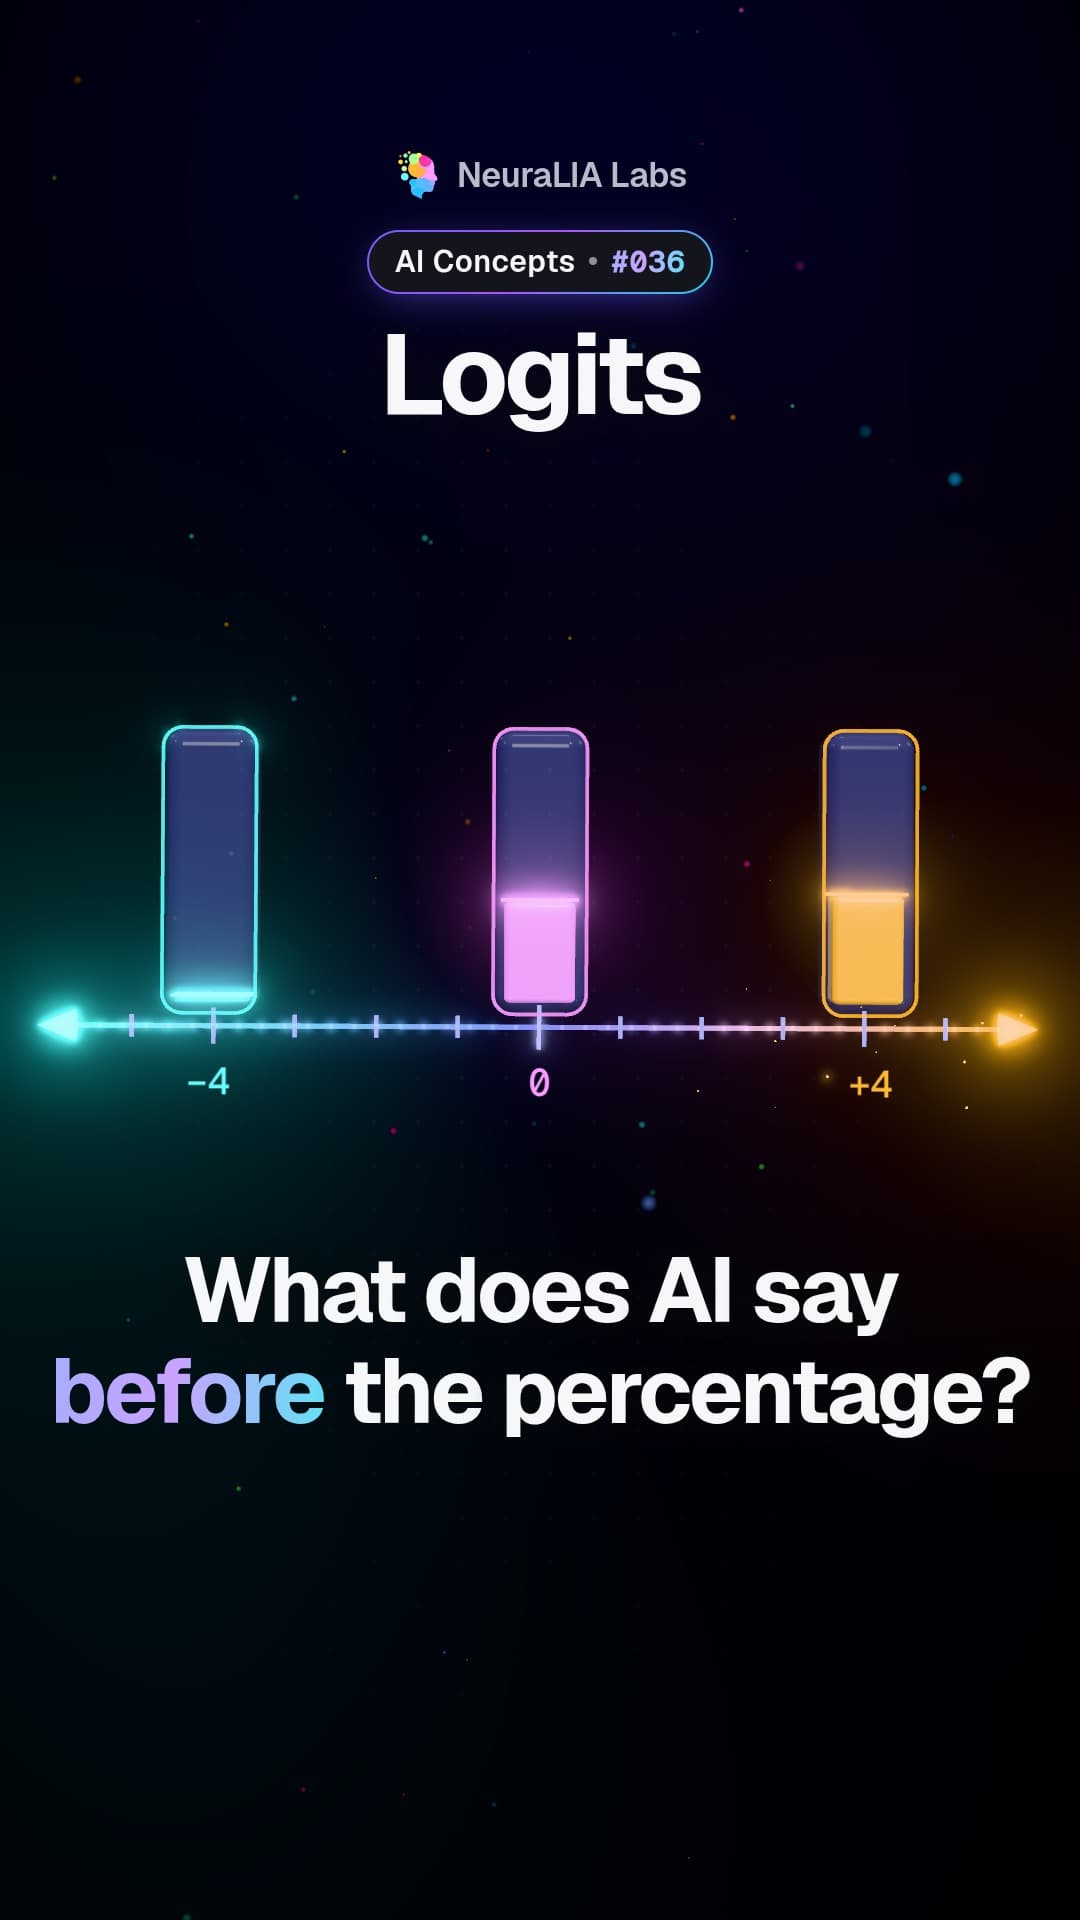 #036
Logits: the raw bet a model places before it gives you a percentage
 #037
Cross-entropy vs MSE: why squared error stalls on its worst mistakes
 #038
Entropy: measuring surprise, and the floor no blind guess can beat
Metin, ücretsiz kursumuzun 4. bölümünden AI desteğiyle yazıldı.