
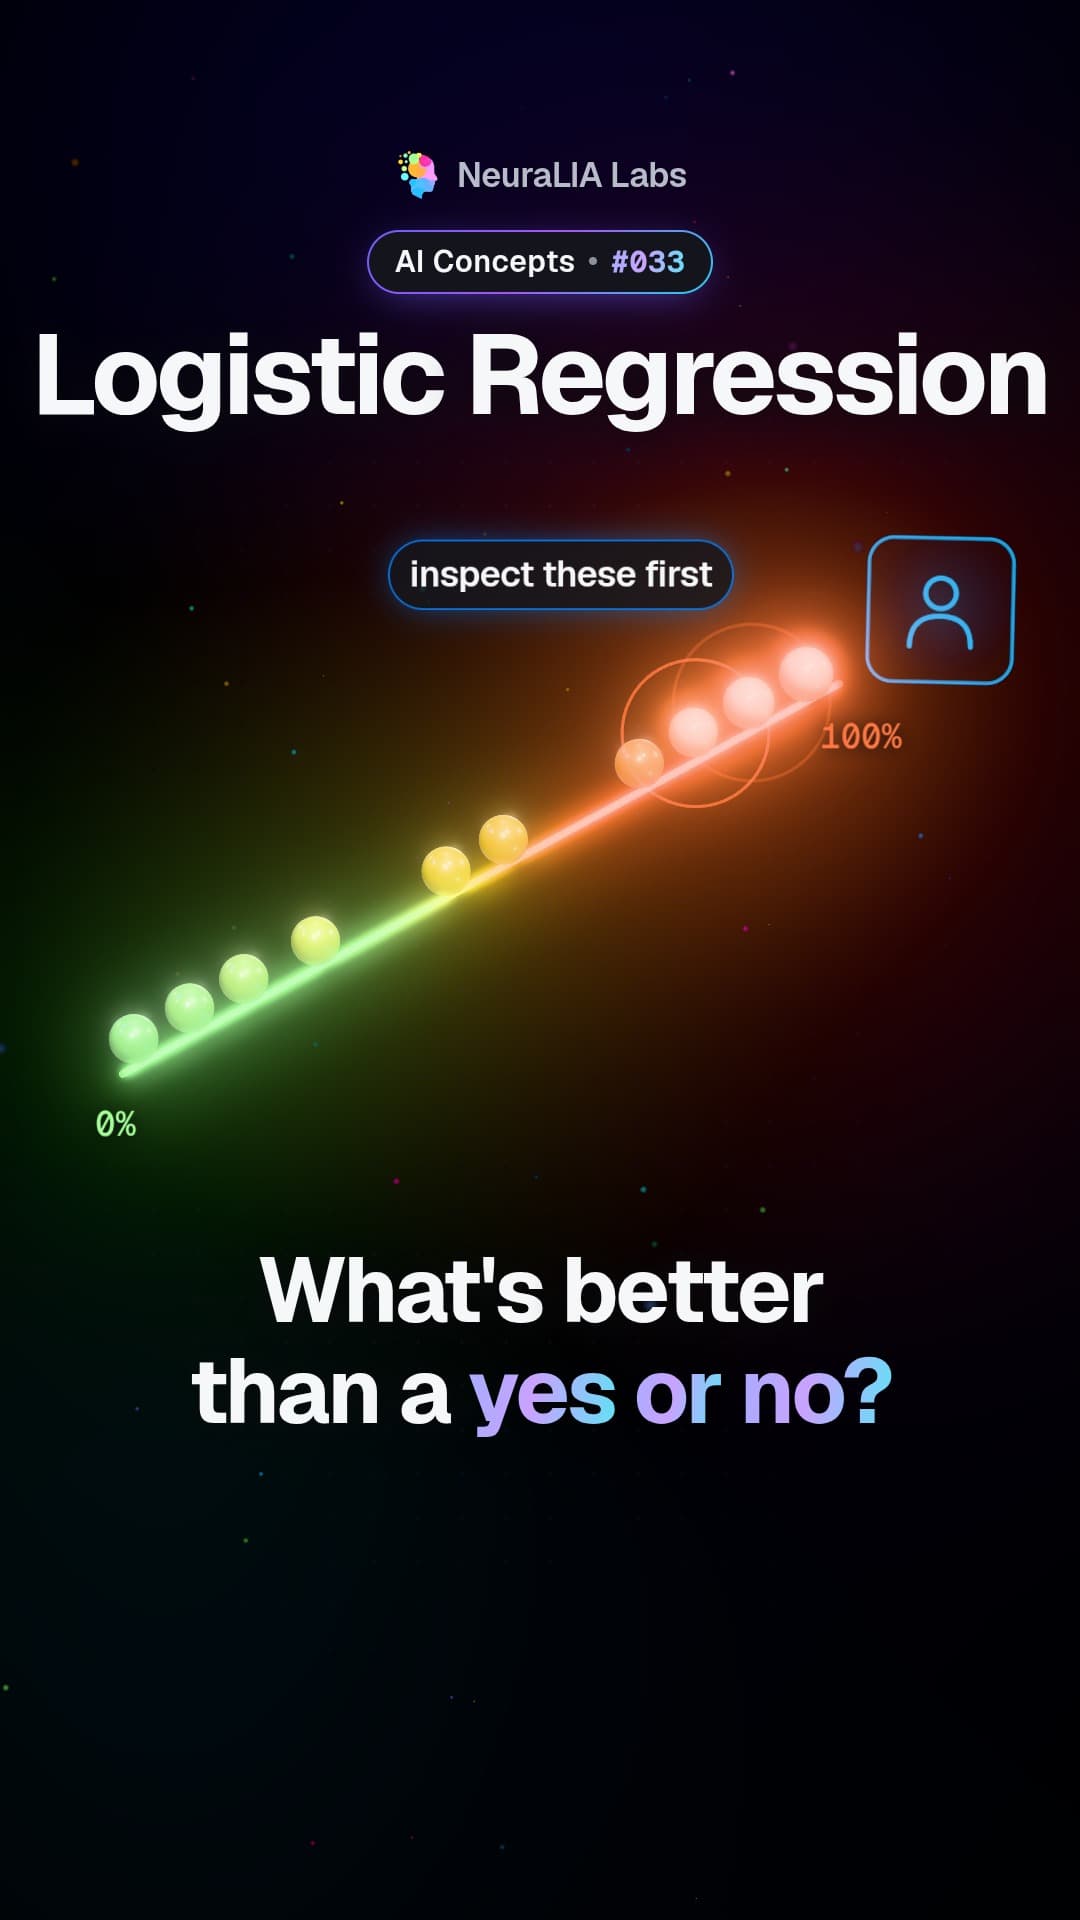
 #033
Ten film i jego tekst są po angielsku.
Sigmoid: the S-shaped curve that turns any score into a probability
A model's raw score can be any number, but a probability must stay between 0 and 1. The sigmoid curve does the squeezing. Here is how, and why its shape matters.
Szczegółowo
What the sigmoid is
The sigmoid is a simple mathematical function whose graph looks like a stretched letter S. You can feed it any number, as negative or as positive as you like, and it always gives back a number between 0 and 1. That makes it the bridge between a model's raw score and a probability.
What the video shows
The video starts from a problem. A model's raw score can be any size, from hugely negative to hugely positive. A probability, on the other hand, has to stay between 0 and 1. The sigmoid is the S-shaped curve that squeezes every possible score into that range.
An everyday example
Imagine a volume knob that you can keep turning forever in both directions, connected to a speaker that can only go from silent to full. Near the middle, every turn of the knob changes the sound a lot. Far out on either side, you can keep turning and almost nothing happens, because the speaker is already nearly silent or nearly at full blast. The sigmoid is the gearing between that endless knob and that limited speaker.
How it works
The formula is 1 / (1 + e^-s), where s is the raw score and e is a fixed number, about 2.718. You never need to work it out by hand. What matters is what it does to a few scores:
| Raw score | Probability after the sigmoid | |---|---| | -4 | 0.018 | | -1 | 0.269 | | 0 | 0.5 | | +4 | 0.982 |
A score of 0 lands exactly in the middle, a coin toss. Large positive scores get close to 1 but never reach it. Large negative scores get close to 0 but never reach it.
Two details make the sigmoid the natural partner of cross-entropy, the score a yes-or-no model is trained on:
- Its slope has a simple form. How steep the curve is at any point equals p × (1 − p), where p is the output. At p = 0.5 that is 0.25, the steepest it ever gets. Near 0 or near 1 it shrinks toward zero: the curve goes flat.
- The slope cancels out. When you combine the curve with cross-entropy, that p × (1 − p) disappears, and the correction the model learns from is simply prediction minus truth.
A detail that matters in practice
Computers store numbers in a limited amount of space. For a very negative score, e^-s becomes enormous and can overflow, which means it grows too large for the computer to hold. The course's code avoids this by switching between two versions of the formula that give the same answer, choosing one or the other depending on whether the score is positive or negative. It is a small example of a lesson from Chapter 2 of the course: a formula that is correct on paper can still break inside a machine.
Why it matters
The flat ends of the S have a price. Pair the sigmoid with the wrong scoring rule, and those flat regions make a model learn almost nothing from its worst mistakes; that is the story of the Cross-Entropy vs MSE episode. Pair it with cross-entropy, and the flatness cancels out, so learning stays strong exactly when the model is badly wrong. The curve also runs in reverse: undoing the sigmoid gives the log-odds, a way of writing the chance of yes against the chance of no, which is where the model's raw score, the logit, gets its name. Knowing the shape of this one curve explains a surprising amount of how simple classifiers behave.
Learn it step by step in Chapter 4 of our free course AI From Scratch: Classification, Cross-Entropy, and How Not to Fool Yourself.
Także na
Więcej z tego rozdziału
- #033
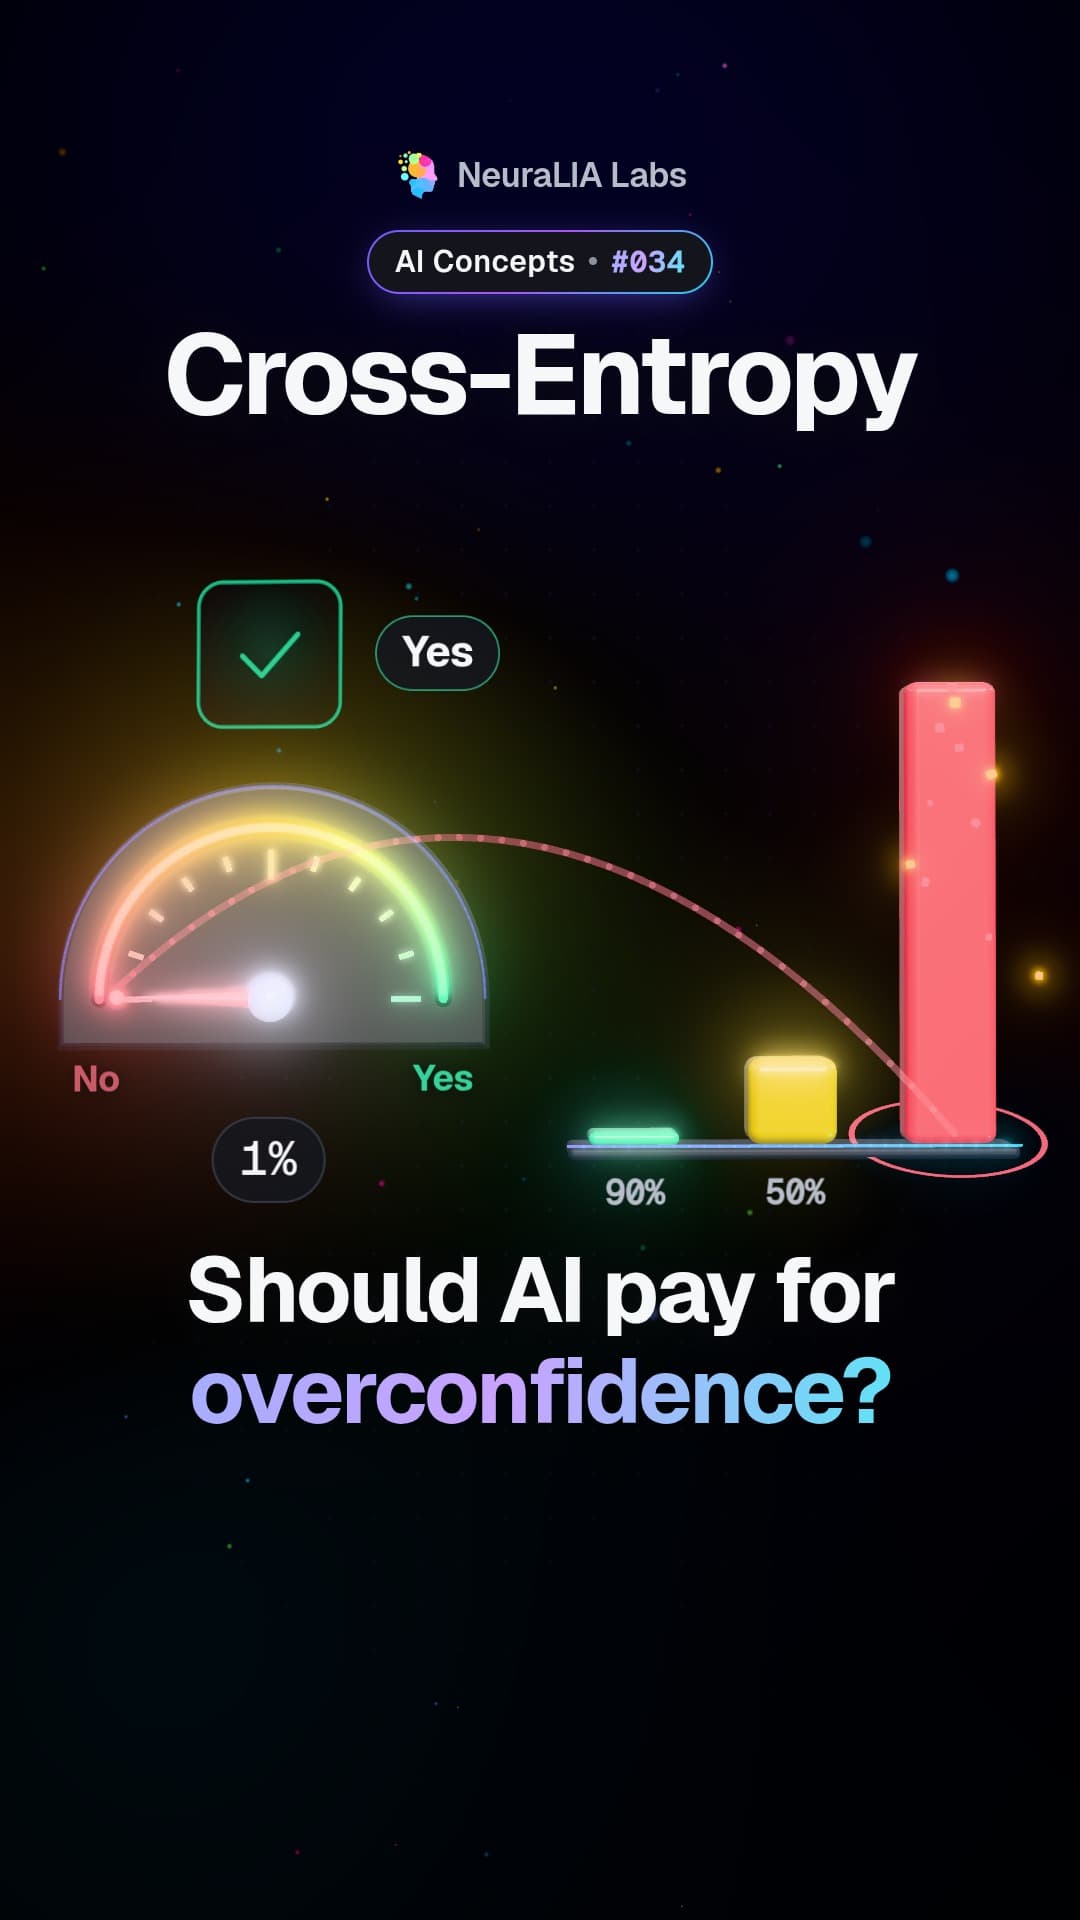 #034
Cross-entropy: the score that makes AI pay for confident mistakes
 #036
Logits: the raw bet a model places before it gives you a percentage
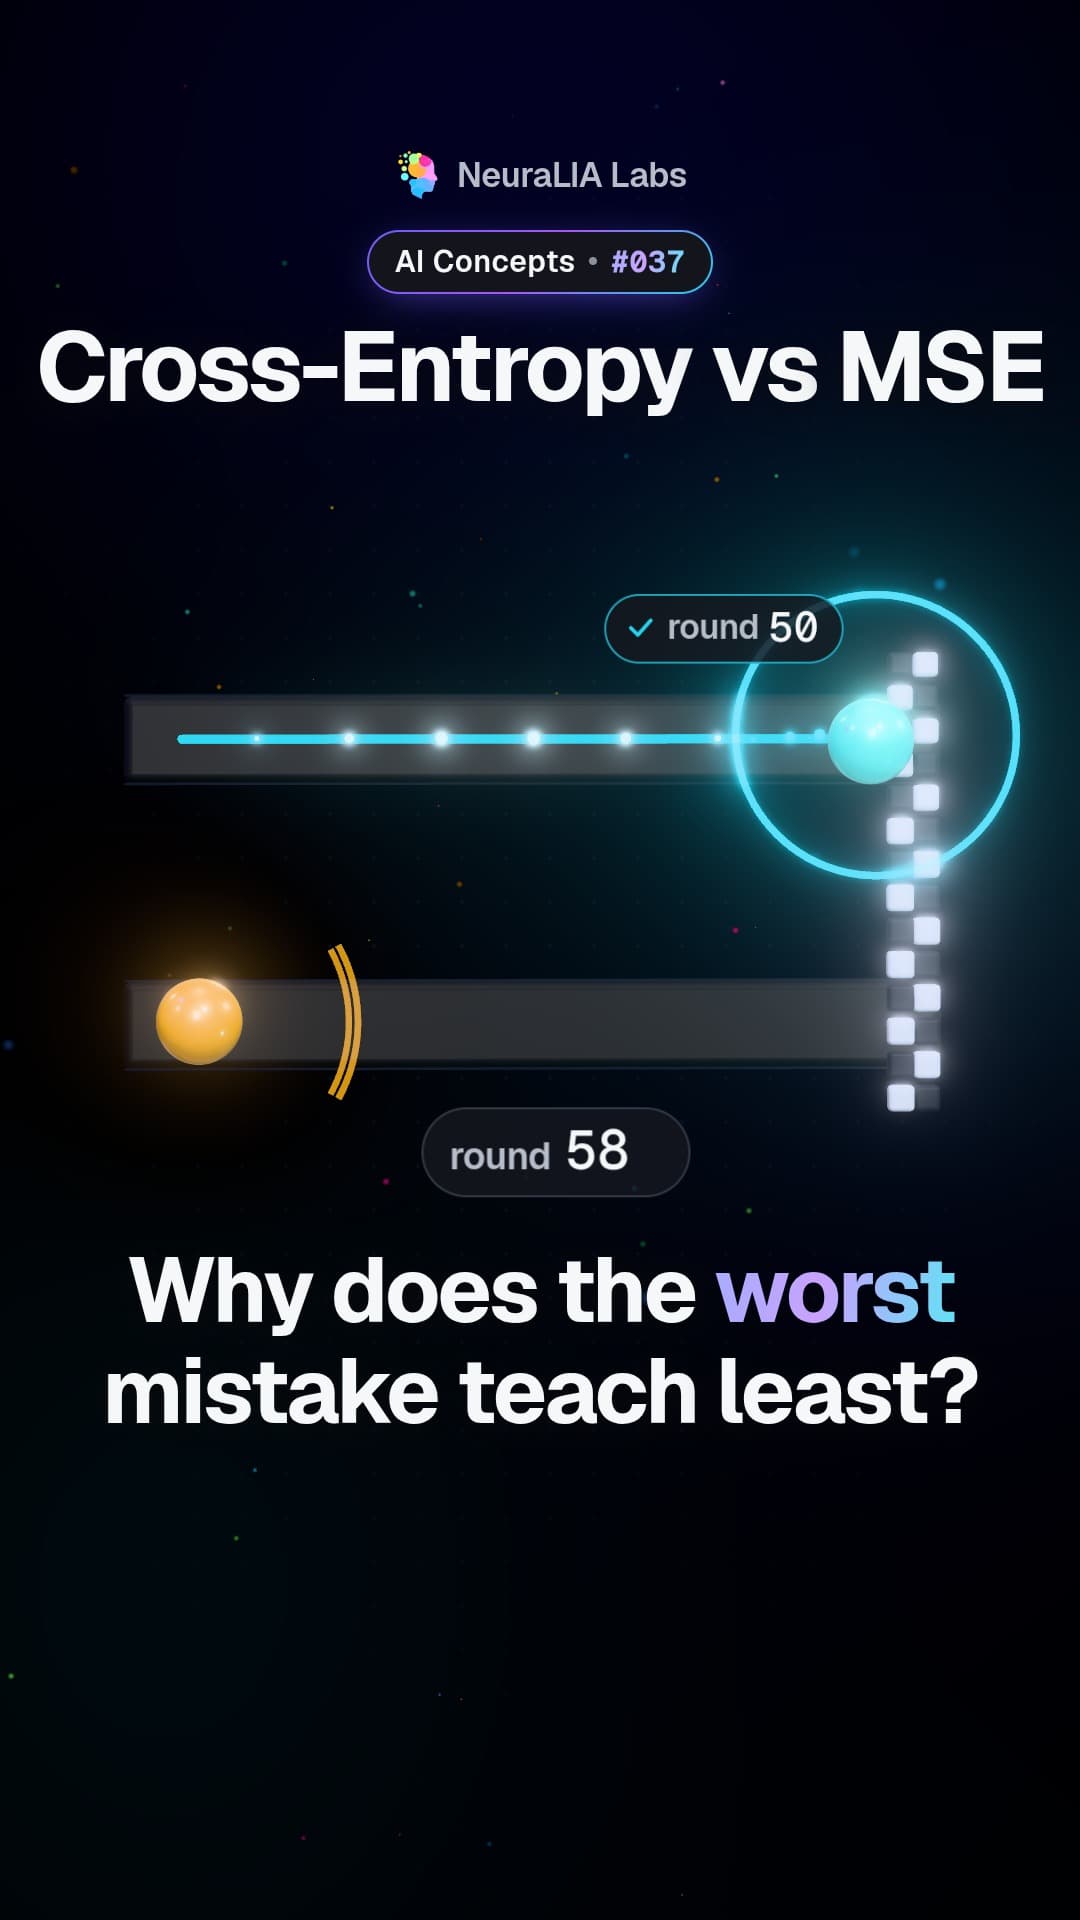 #037
Cross-entropy vs MSE: why squared error stalls on its worst mistakes
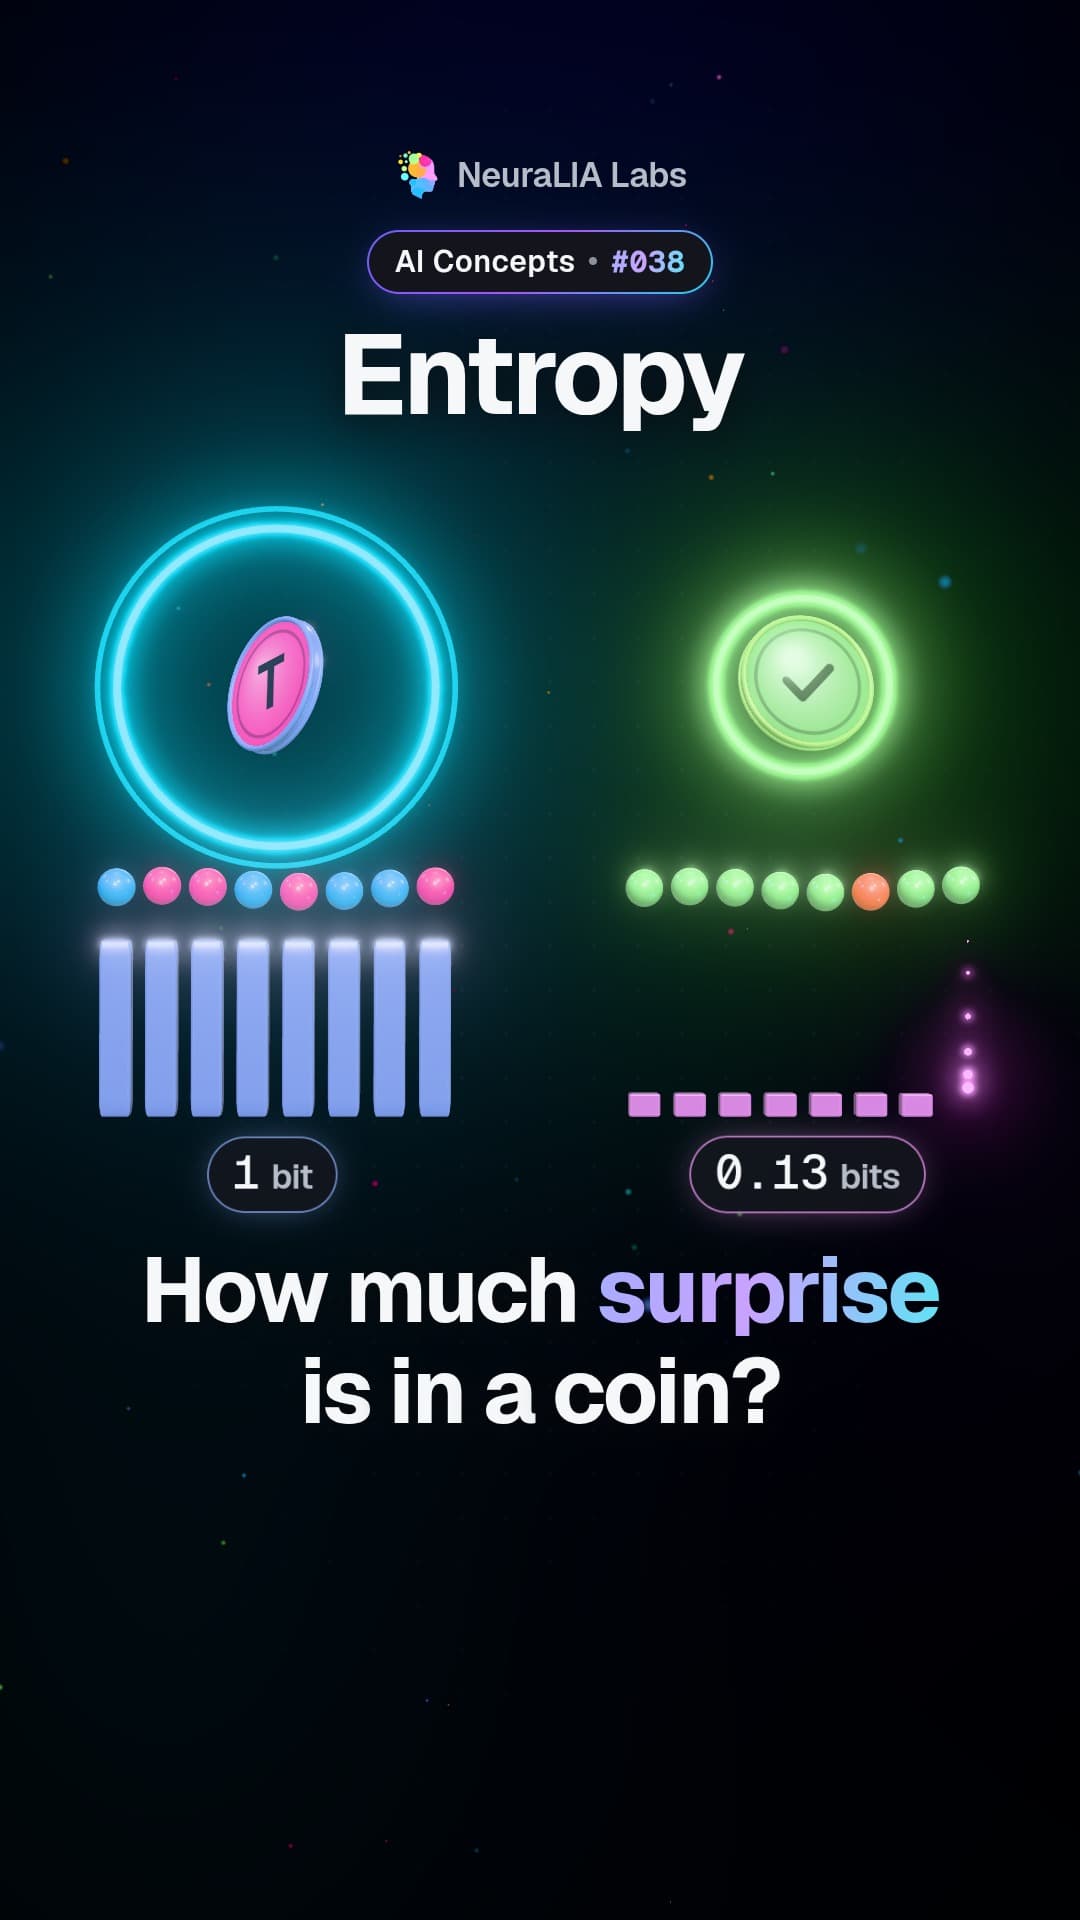 #038
Entropy: measuring surprise, and the floor no blind guess can beat
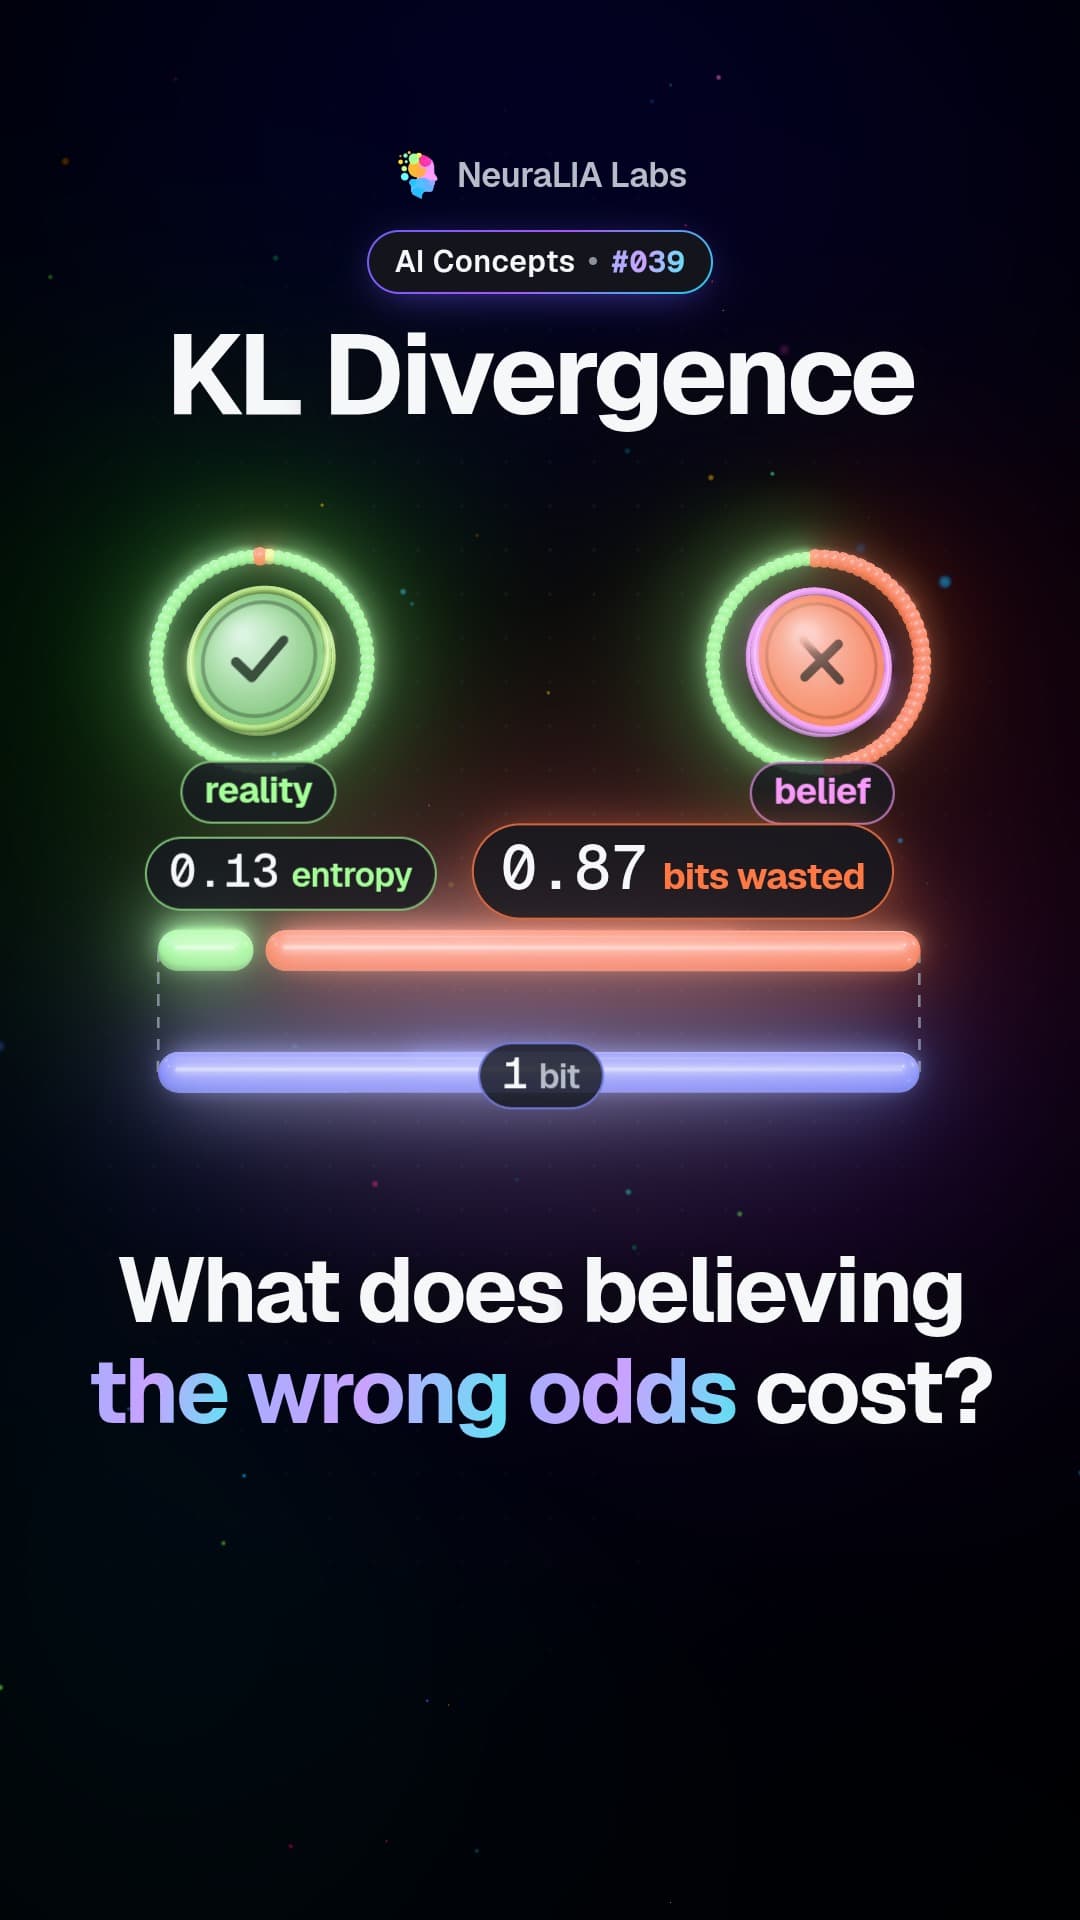 #039
KL divergence: the price of believing the wrong odds
Tekst napisany z pomocą AI na podstawie rozdziału 4 naszego darmowego kursu.